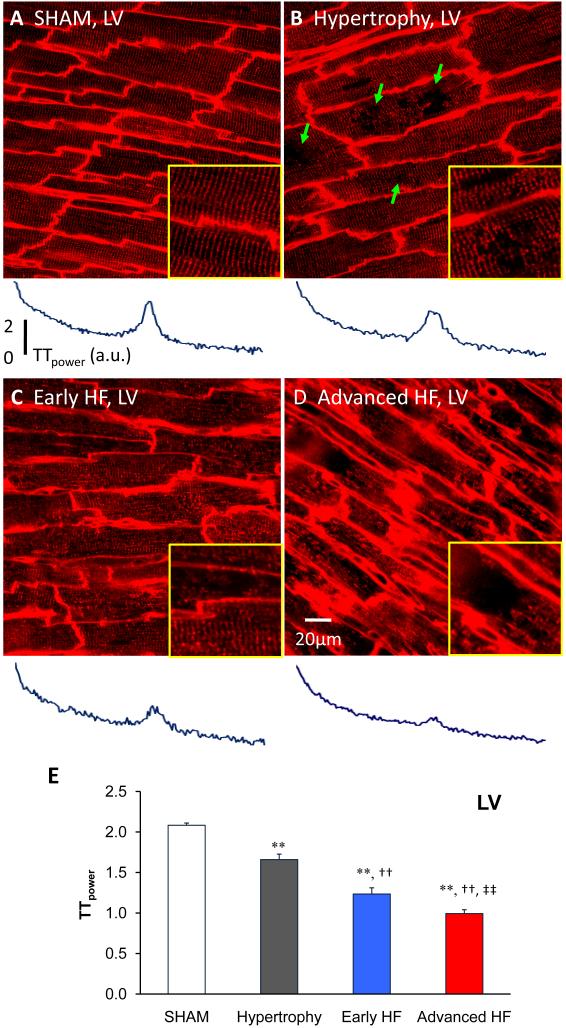
Figure 3. Progressive t-tubule remodeling of LV myocytes in TAB rat cardiomyopathy.
Representative t-tubule images from LV of age-matched sham operated heart (A), hypertrophy (B), early HF (C) and advanced HF (D). The bottom panels showed the power spectrums obtained from 2D Fourier transform of the raw images above. At hypertrophy stage (B), discrete T-tubule loss (green arrows) was often observed with slight t-tubule disorganization, which caused a mild decrease in TTpower. In moderately de-compensated heart (C), LV myocytes exhibited widely impaired t-tubule system and further decrease in TTpower. At advanced HF stage (D), myocytes lost majority of t-tubules with striated pattern almost vanished, resulting in severe reduction in TTpower. Each yellow-framed inset is a zoom-in view of an area 40×40 μm from associated images. E. Summarized data of LV myocyte t-tubule power (N=7, 12, 7, 7 hearts for sham, hypertrophy, early HF and advanced HF, respectively). Note: **, p<0.01 vs sham; †, p<0.05; ††, p<0.01 vs hypertrophy; ‡, p<0.05; ‡‡, p<0.01 vs early HF.

