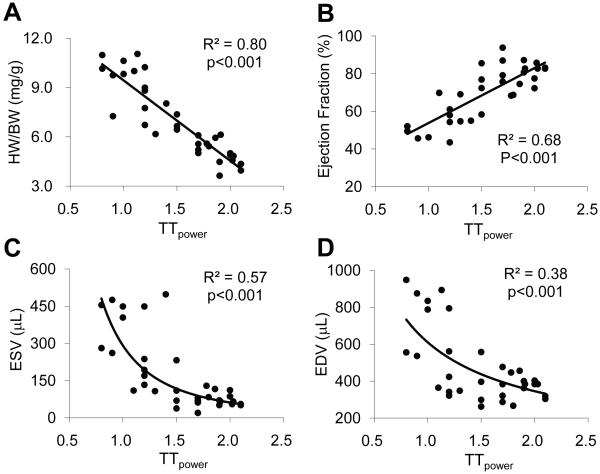
Figure 6. Correlation between TTpower and LV function.
The LV TTpower was in good linear correlation with HW/BW ratio (R2=0.80, p<0.001) (A) and EF (R2=0.68, p<0.001) (B). Moreover, the LV TTpower was well fitted in power function with end systolic volume (ESV) (R2=0.57, p<0.001) (C) and end diastolic volume (EDV) (R2=0.38, p<0.001) (D).

