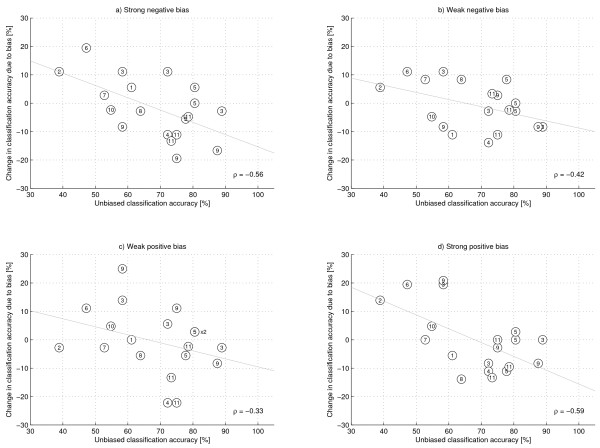
Figure 2.
Unbiased classification accuracy vs. deviation in accuracy due to feedback bias. Unbiased classification accuracy vs. deviation from this accuracy due to feedback bias. A +10% value in the y-axis represents a 10% improvement in absolute mean accuracy. Each dot corresponds to one session, the numbers identificating the subjects. Least squares regression lines for each type of feedback bias are shown in grey along with their correlation coefficient. The x2 maker denotes overlapping datapoints corresponding to the same subject.

