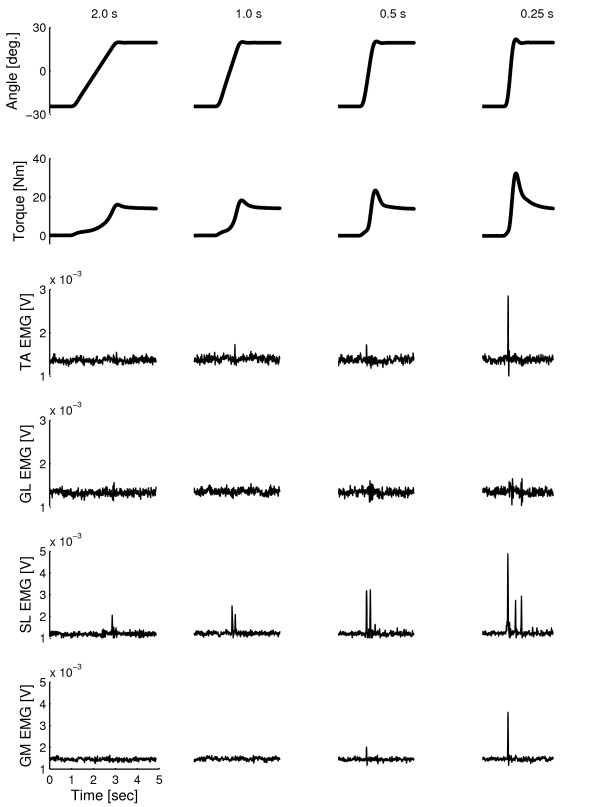
Figure 3.
Imposed ramp-and-hold movement profiles, joint torque and IEMG. Rows from top to bottom: Ankle joint angle showing the imposed (dorsiflexion) ramp-and-hold (RaH) joint rotation profiles at four different movement durations (columns: 0.25, 0.5, 1.0, 2.0 s), corresponding joint torque responses and IEMG signals from all four muscles. Traces are shown over a five second time frame for an AS3 patient. Positive values indicate to dorsiflexion.

