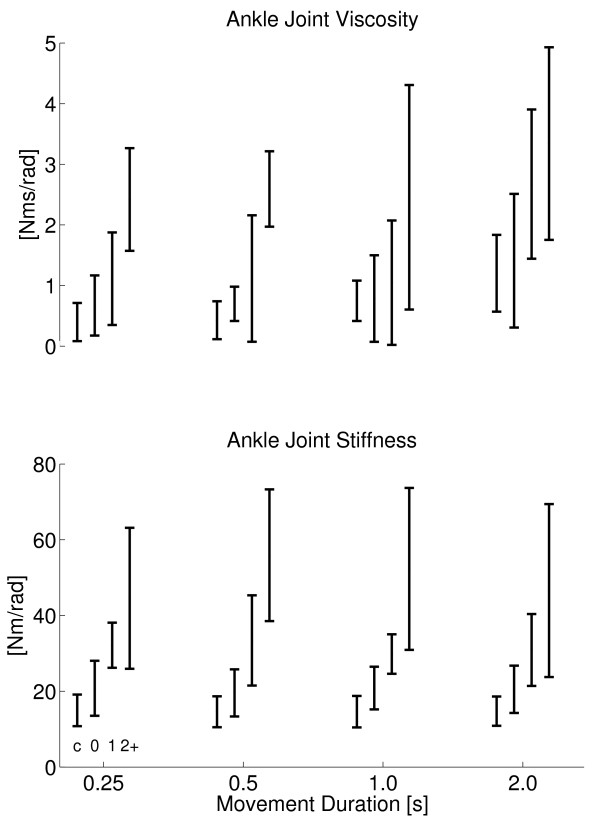
Figure 8.
Ankle Joint Viscosity and Stiffness. Viscosity (top) and stiffness (bottom) for all subject groups against dorsiflexion duration. Subject groups (C, AS0, AS1, AS2+) from left to right for each cluster, denoted by c, 0, 1 and 2+ respectively. Joint viscosity and stiffness were taken at the same ankle angle for all subjects (controls and patients) being 3.03 degrees dorsiflexion (see Methods).

