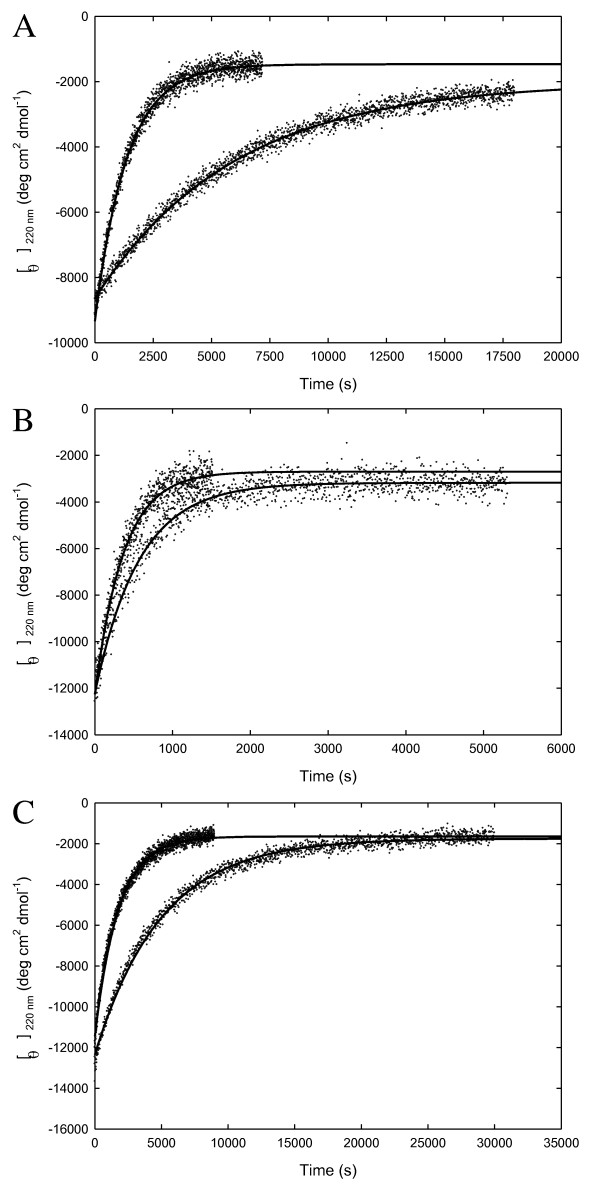
Figure 2.
Unfolding kinetic curves of RNases H at 25°C. (A) Curves 1 and 2 represent the unfolding traces to a final concentration of 4.8 and 3.8 M GdnHCl of Tm-RNase HII at pH 7.5. (B) Curves 1 and 2 represent the unfolding traces to a final concentration of 4.0 and 3.5 M GdnHCl of Aa-RNase HII at pH 5.0. (C) Curves 1 and 2 represent the unfolding traces to a final concentration of 7.5 and 7.0 M GdnHCl of Sto-RNase HI at pH 3.0. The lines represent the fit of Eq. (5).

