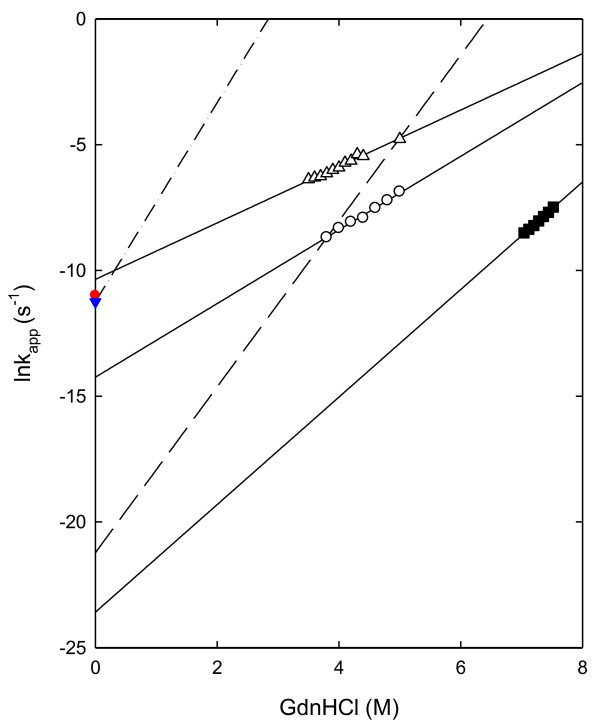
Figure 3.
GdnHCl concentration dependence of the apparent rate constant (ln kapp) of the unfolding of RNases H at 25°C. Open circles represent the data of Tm-RNase HII at pH 7.5; open triangles, that of Aa-RNase HII at pH 5.0; and closed squares, that of Sto-RNase HI at pH 3.0. The lines represent the fit of Eq. (6). Long dashed line represent the data of Tk-RNase HII and one-point dashed line represent Ec-RNase HI [19,31]. The red circle and blue triangles represents the ku(H2O) value obtained from urea-induced unfolding experiments with Ec-RNase HI [33] and Tt-RNase HI [21], respectively.

