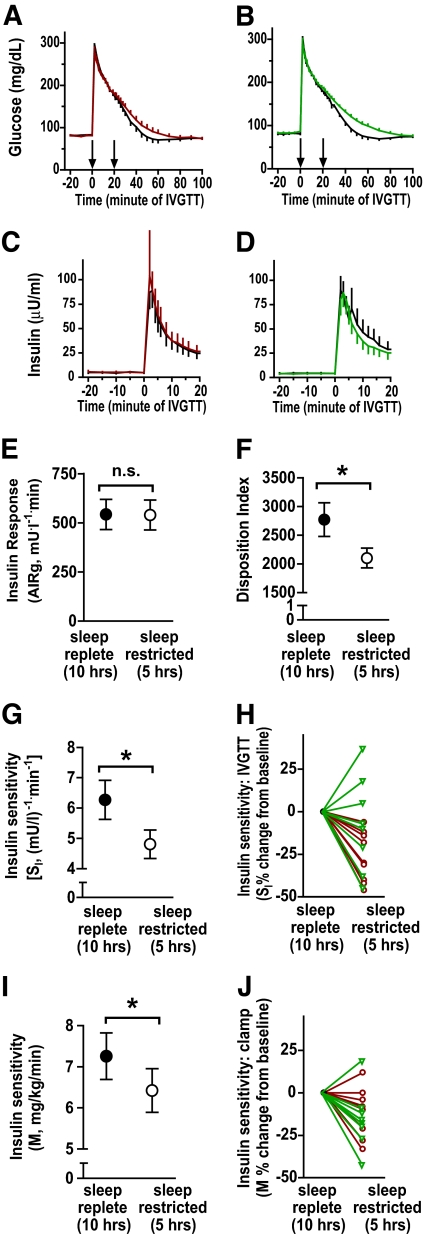
FIG. 4.
Effects of sleep restriction on glucose metabolism. A and B: Mean glucose levels (± SE) from IVGTT during the baseline sleep-replete condition (10 h/night TIB [black line]) and following sleep restriction for 1 week (5 h/night TIB) in subjects receiving placebo (A) (red line) modafinil (B) (green line). Left arrow, glucose infusion at time = 0 min; right arrow, insulin infusion at time = 20 min. C and D: Mean insulin levels (± SE) from IVGTT. E–H: IVGTT parameters were calculated using Minmod Millennium software. Glucose and insulin data from insulin-modified IVGTT procedures under sleep-replete (filled symbols) and sleep-restricted conditions (open symbols) are shown. E: Acute insulin response (AIRg) (first phase). F: Disposition index. G: SI from IVGTT. H: relative changes in SI from IVGTT expressed as percent change from baseline sleep-replete condition in subjects randomized to placebo (red circles) or modafinil administration (green triangles). I: Insulin sensitivity (M) from euglycemic-hyperinsulinemic clamp procedure. J: Relative changes in insulin sensitivity (M) depicted as in F. There were no significant effects of drug administration on any metabolic parameters (Table 1).

