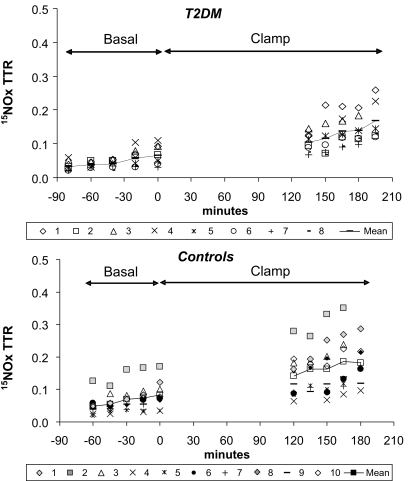
FIG. 3.
Whole-blood TTR values of 15NOx in the basal and in the clamp period, reported as individual values in the type 2 diabetic (T2DM) (upper panel, n = 8) and in the control subjects (bottom panel, n = 10). From the change in TTR versus time in each experimental period, the slopes reported in Table 3 have been calculated.

