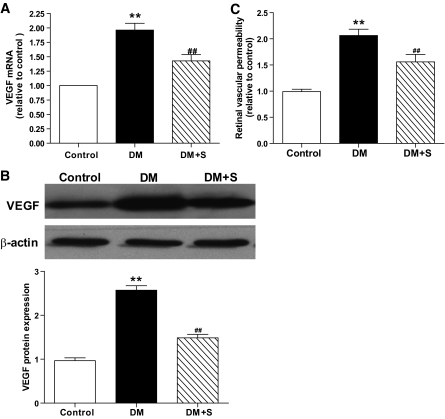
FIG. 1.
Changes of retinal VEGF levels in the control rats (control), diabetic rats (DM), and diabetic rats treated with simvastatin (DM + S). A: Real-time RT-PCR determination of VEGF mRNAs relative to the control values. B: Western blot analysis of VEGF protein expression in the three groups. Equal protein loading was confirmed by detection of β-actin. C: Retinal vascular permeability in the three groups. Bars indicate SD. A representative experiment of the three is shown (**P < 0.01 vs. control; ##P < 0.01 vs. DM; n = 8).

