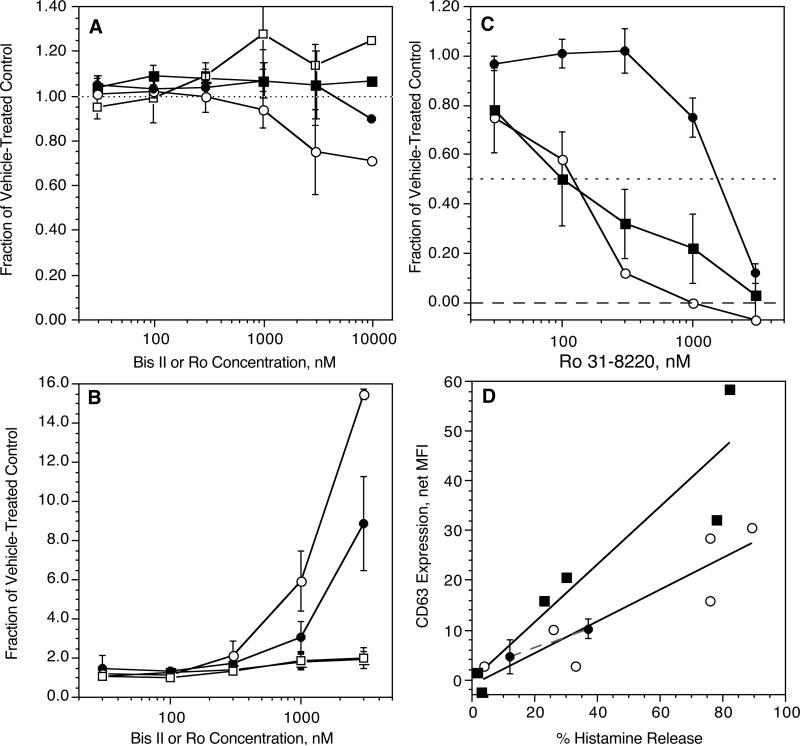
Figure 2.
Inhibition of CD63 and CD203c expression by PKC inhibitors Ro-31-8220 and Bisindolylmalimide II. Panel A (n=3); basophils were incubated with vehicle control (DMSO) or inhibitor for 10 minutes at the concentrations shown, (○) Ro 31-8220 (•) or Bis II and CD63 expression, (□) Ro-31-8220 or (■) Bis II and CD203c expression and then stimulated with 100 nM FMLP for 10 minutes, fixed, and assessed for marker expression. Panel B (n=3); basophils were incubated with vehicle control (DMSO) or inhibitor for 10 minutes at the concentrations shown, (○) Ro 31-8220 (•) or Bis II and CD63 expression, (□) Ro-31-8220 or (■) Bis II and CD203c expression and then stimulated with 0.5 μg/ml anti-IgE Ab for 30 minutes, fixed, and assessed for marker expression. Panel C (n=3); basophils were incubated with vehicle control (DMSO) or Ro-31-8220 for 10 minutes at the concentrations shown, then stimulated with PMA at 50 ng/ml and assessed for (○) CD63 (•) CD203c or histamine release (■). Panel D (n=2); as described in the text, basophils were stimulated with either 3, 10, 100 nM FMLP, 0.01, 0.05 or 0.5 μg.ml anti-IgE Ab or 50 ng/ml PMA in 2 separate experiments and either CD63 or histamine release assessed. The data for each stimulus is plotted with a different symbol and each sample results a separate point on the plot, (■) FMLP, (○) anti-IgE Ab, (•) PMA (with error bars from replication within the experiment). In these figures, the data is based on the net median fluorescence for the marker being examined.

