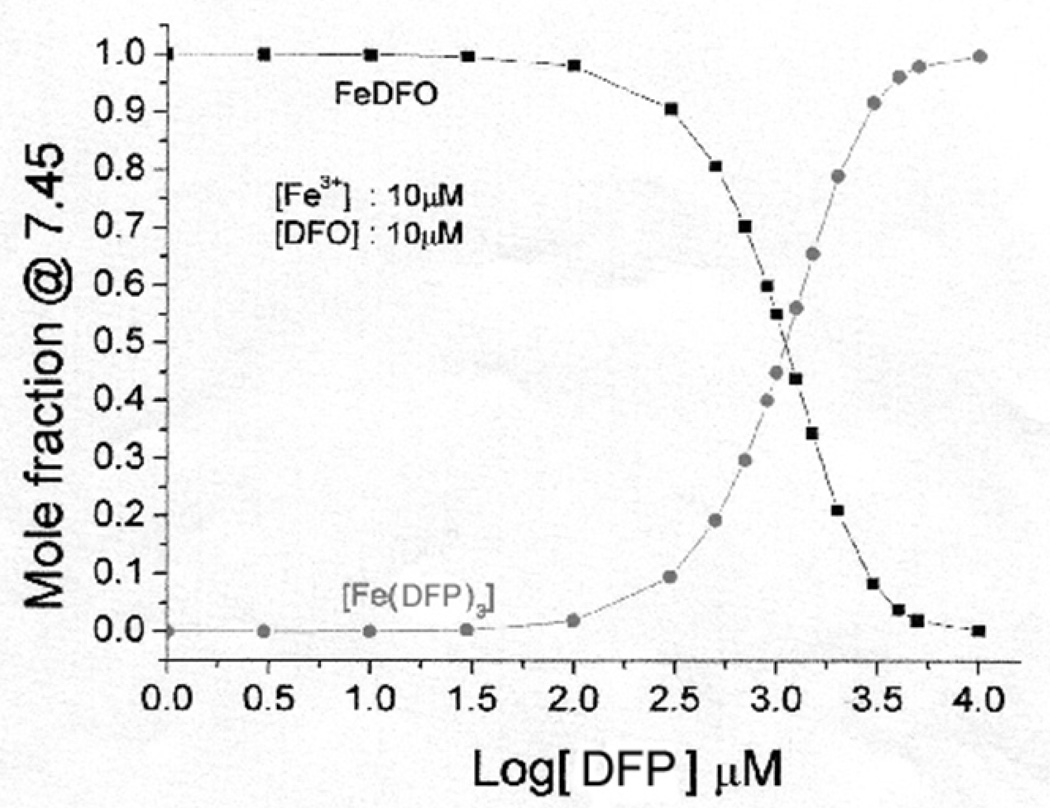
Fig 1.
Speciation plot showing the molar fraction of iron bound to DFO or to DFP at steady state. The speciation plot was calculated using HYSS 29, where the concentrations of iron and DFO are constant at 10µM, and the concentration of DFP was varied. The stability constants used for the calculations were from published data 24.

