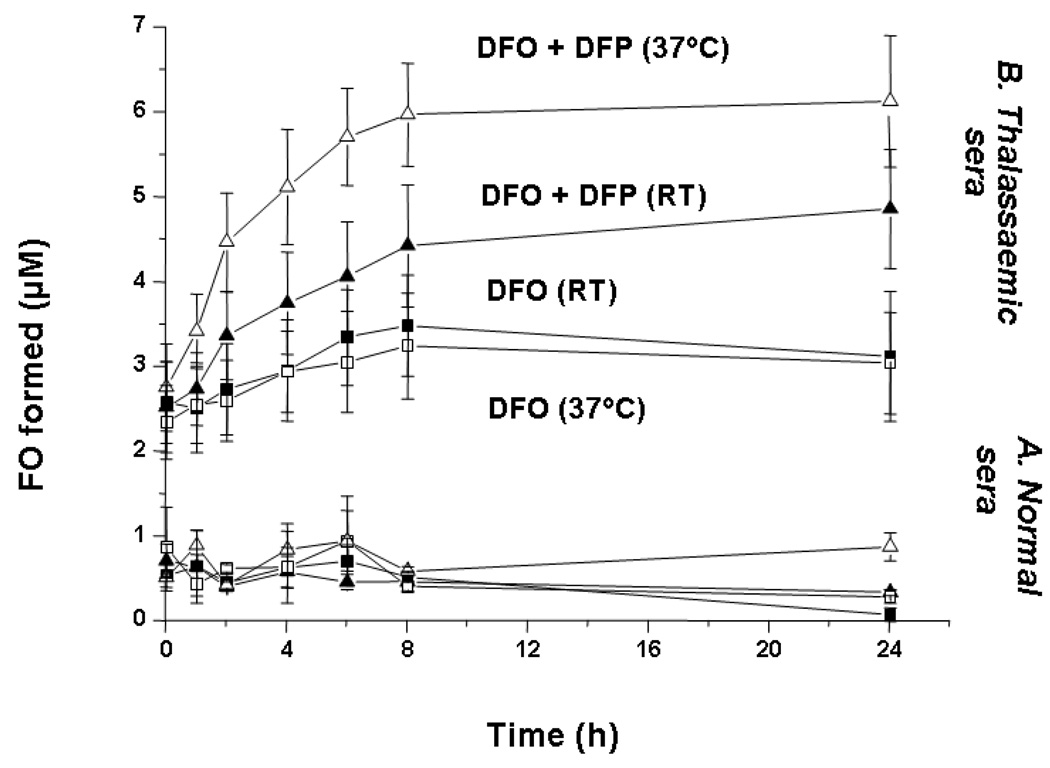
Fig 3.
Rate of FO formation from normal and thalassemic plasma incubated with DFO. DFO (10 µM) was incubated with serum obtained from 5 normal subjects and six thalassemic patients whose serum contained 3.5–5.4 µM NTBI either alone (■) or in the presence of DFP (▲, 30 µM) both at RT (closed symbols) and 37°C (open symbols). Samples of the reaction mixtures were taken at regular time intervals, deproteinized through 30 Kda molecular weight cut-off filters and 50 µl of filtrate injected onto the HPLC column for FO determination using isocratic HPLC conditions. FO concentrations were determined using a standard curve showing the peak areas corresponding to known dilutions of a freshly prepared 200 µM FO mixture in 20mM MOPS pH 7.4. The data shown are the mean ± SE for the two study groups.

