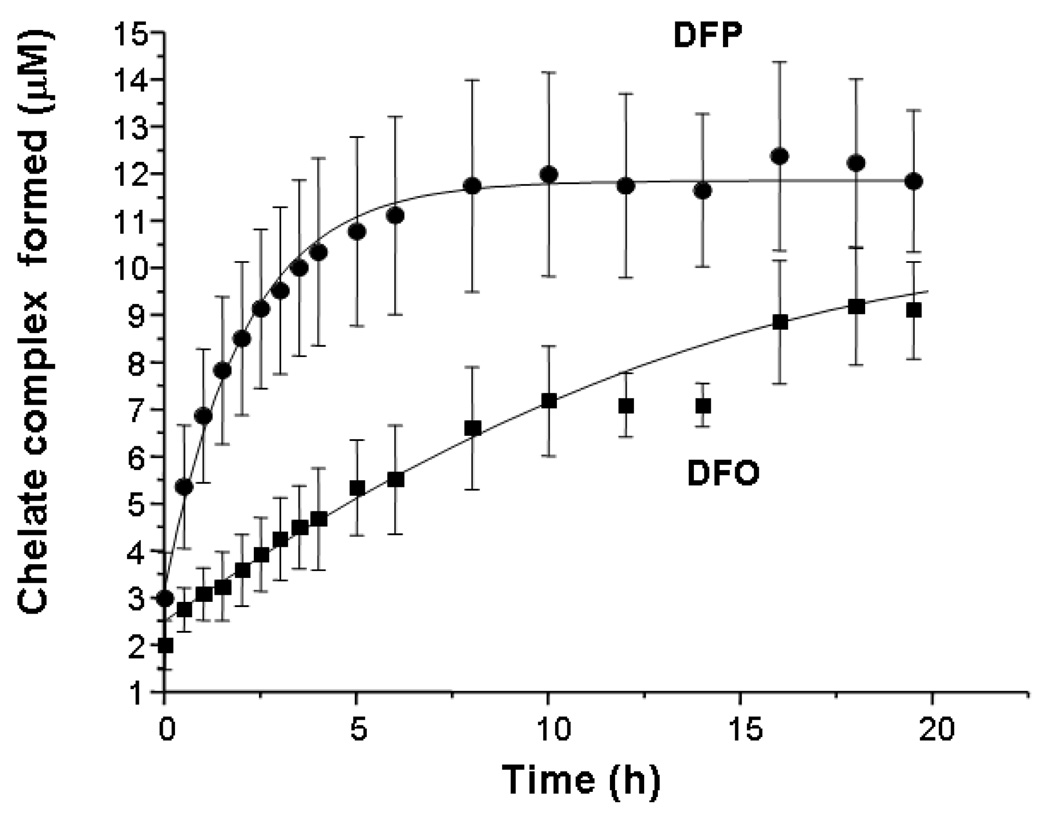
Fig 4.
Rates of iron complex formation from iron citrate incubated with DFO or DFP alone. The rates of formation of iron complexes of DFO or DFP from iron citrate (10:100 µM) in 20mM MOPS (pH 7.4) were compared at equimolar iron binding equivalents of the two chelators, using spectrophotometry. The reaction was monitored continuously for 19.5h at 460nm at RT with DFO (■, 10 µM) or DFP (▲, 30 µM). Iron complex concentrations were calculated using previously determined extinction coefficients for both iron complexes. The data shown are the mean ± SE of 3 independent experiments.

