Fig 5.
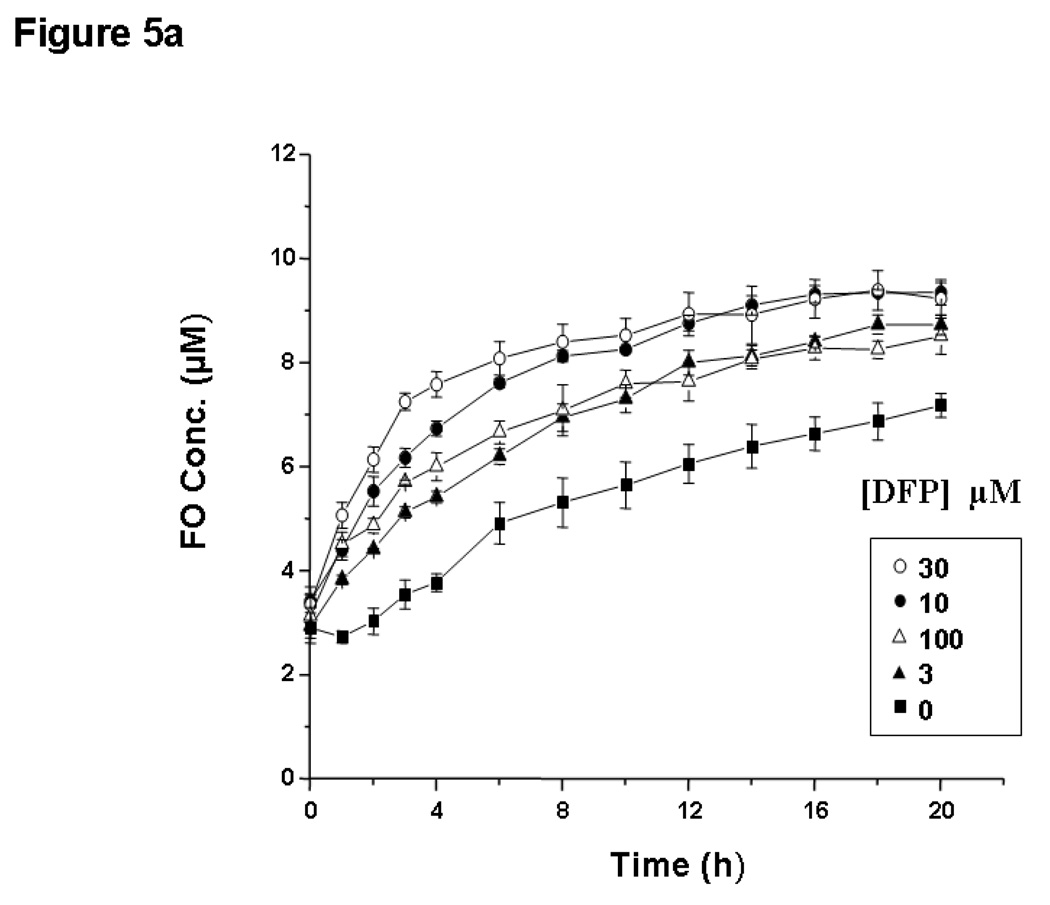
Enhancement of FO formation from iron citrate by DFP using HPLC: effects of DFP concentration and temperature. Fig 5a: DFP-concentration dependence of enhancement of FO formation from iron citrate and DFO is shown. DFO (10 µM) was incubated with iron:citrate (10:100 µM) in 20mM MOPS (pH 7.4), either alone or in the presence of various concentrations of DFP (3–100 µM) at RT. Samples of the reaction mixtures were taken at regular time intervals and injected onto the HPLC column for FO determination using isocratic elution. FO concentrations were determined as described for Figure 3. The data shown are the mean ± SE of 3 independent experiments. Fig 5b: Temperature dependence of rate of FO formation from iron citrate and DFO in the presence and absence of DFP. DFO (■, 10 µM) was incubated with iron-citrate (10:100 µM) in 20mM MOPS (pH 7.4), either alone or in the presence of DFP (▲, 30 µM) at RT (closed symbols) and 37°C (open symbols). Samples of the reaction mixtures were then taken at regular time intervals and injected onto the HPLC column for FO determination as described above. The data shown are the mean ± SE of 4 independent experiments.


