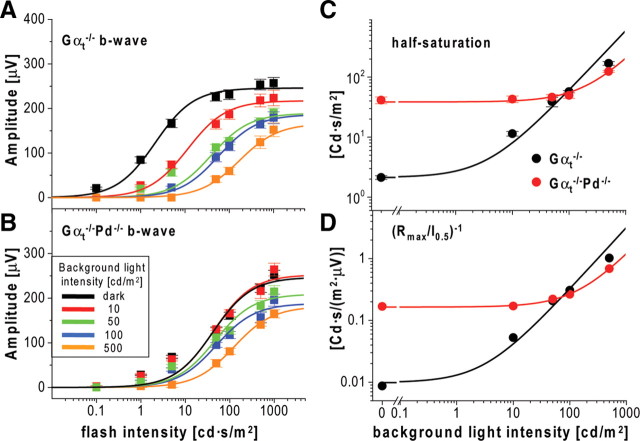
Figure 11.
Dark-adapted cone-driven b-waves in Gαt−/−Pd−/− mice are greatly desensitized in the dark. A, B, Averaged b-wave amplitudes recorded from 11 eyes of Gαt−/− (A) and Gαt−/−Pd−/− (B) mice were plotted as functions of flash strength. The data were fitted using a single term of Equation 1, and the fitting parameters are summarized in Table 5. C, The values of b-wave half-saturating flash intensities were plotted as a function of background luminance and fitted with the Weber equation, I0.5 = K × (IB + ID), where K is a constant, IB is the background light intensity, and ID is the intensity at which b-wave dark sensitivity was reduced by a factor of 2 (Saszik et al., 2002). The fitting parameters were K = 0.59 ± 0.02, ID = 3.6 ± 2.4 cd/m2 for Gαt−/− mice (coefficient of determination, R2 = 0.98) and K = 0.17 ± 0.01, ID = 229 ± 7 cd/m2 for Gαt−/−Pd−/− mice (R2 = 0.99). D, The Weber analysis of the inverted Rmax/I0.5 ratios was performed as in C. The fitting parameters were K = 0.0032 ± 0.0002, ID = 3.1 ± 1.2 cd/m2 for Gαt−/− mice (R2 = 0.98) and K = 0.0010 ± 0.0001, ID = 158 ± 1 cd/m2 for Gαt−/−Pd−/− mice (R2 = 0.99). It should be noted that these plots were initially fitted with a generalized Weber relation (Rmax/I0.5)/(Rmax/I0.5)dark = 1/(1 + (Ib/ID)n) (Cameron et al., 2006), where a slope of n = 1 would indicate changes in b-wave sensitivity that were proportional to changes in background luminance, as assumed in the analysis described above. The slopes were actually close to 1 (n = 0.88 ± 0.04 for Gαt−/− and n = 1.02 ± 0.09 for Gαt−/−Pd−/− mice).

