
Figure 2.
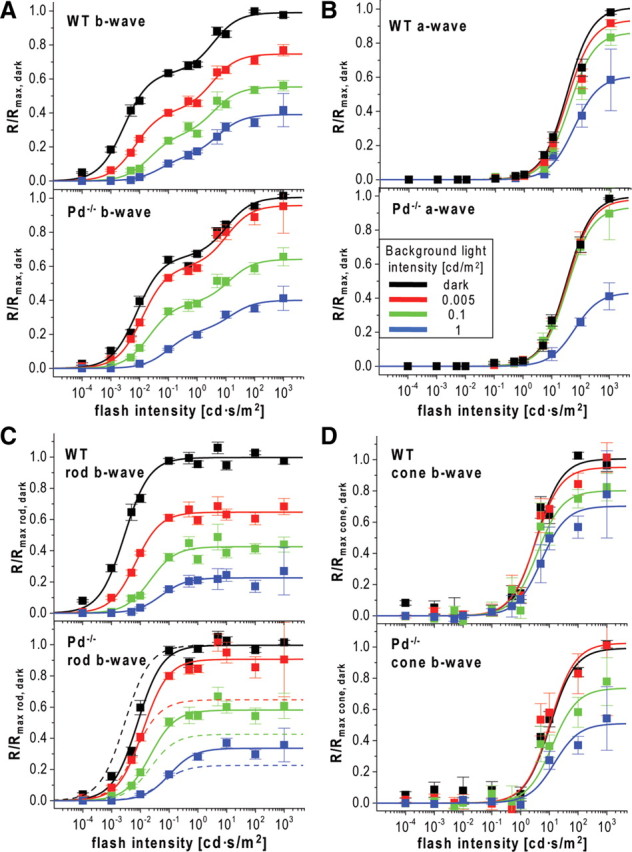
Reduced dark-adapted flash sensitivity and abnormal light adaptation in Pd−/− mice. A, B, Response amplitudes, R, of ERG b-waves (A) and a-waves (B) from WT and Pd−/− mice were normalized to the maximal values measured in the dark (Rmax, dark) and plotted as functions of flash intensities. Data were fitted by Equation 1 using either both terms (A) or a single term (B). The fits are shown as solid lines, and the corresponding parameters are summarized in Table 1. C, D, The rod- and cone-driven components of the b-wave stimulus–response curves in A are plotted individually and normalized to the corresponding maximal amplitudes in the dark. Fits of the WT data from the top in C are replotted as dashed lines in the bottom of C to visualize the difference between WT and Pd−/− mice. Color code: Dark-adapted mice, black; light adapted at 0.005 cd/m2, red; 0.1 cd/m2, green; 1 cd/m2, blue.