
Figure 3.
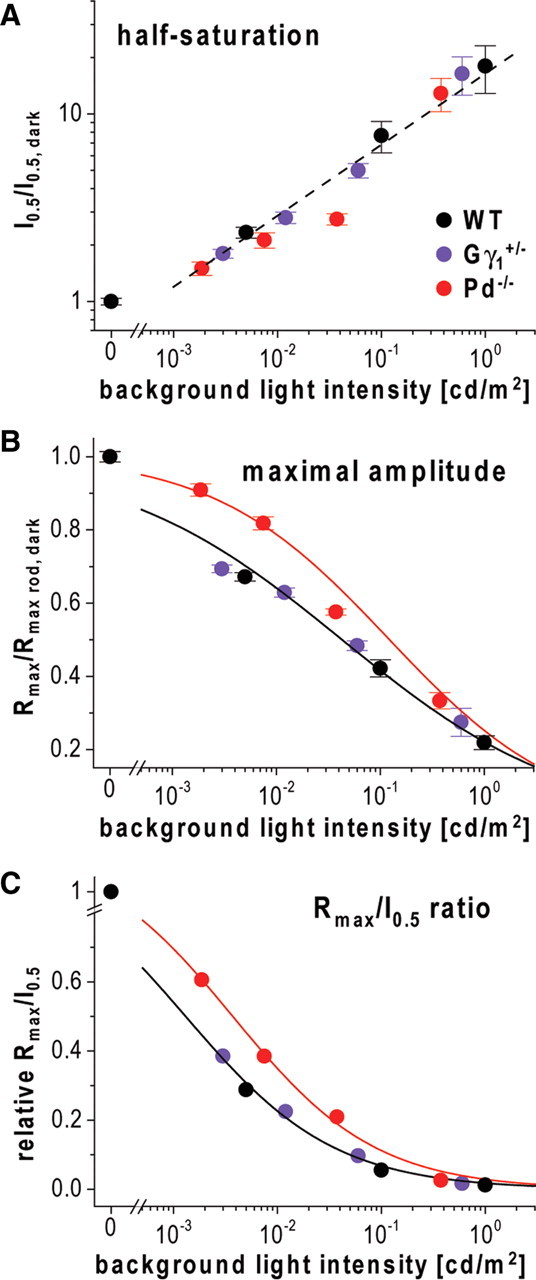
Phosducin knock-out reduces response compression but not stimulus scaling during b-wave light adaptation. A, The values for flashes evoking half-saturating rod-driven b-wave amplitudes, I0.5, taken from Tables 1 and 3 were normalized to the dark-adapted values, I0.5, dark, and plotted as functions of background luminance. The data for WT mice are shown in black, for Pd−/− mice in red and Gγ1+/− mice in violet. The background luminance values for Pd−/− and Gγ1+/− mice were further corrected to account for the reduced dark-adapted b-wave light sensitivity in these animals, as described in Results. The straight dashed line represents the best fit to all three datasets. B, Normalized maximal amplitudes of rod-driven b-wave stimulus–response curves in Tables 1 and 3 (Rmax/Rmax rod, dark) are plotted as functions of background luminance. The values for background strength for Pd−/− and Gγ1+/− mice were corrected as in A. Solid lines represent data fits to Equation 2 (WT and Gγ1+/− combined, Ihalf = 0.043 ± 0.003 cd/m2, n = 0.40 ± 0.02; Pd−/−, Ihalf = 0.085 ± 0.008 cd/m2, n = 0.54 ± 0.03; error bars represent SEM). C, The Rmax/I0.5 ratios for rod-driven b-waves were normalized to their dark-adapted values and plotted as functions of background luminance. The values for background strength in Pd−/− and Gγ1+/− mice were corrected as in A. Solid lines represent data fits to Equation 2 (WT and Gγ1+/− combined, Ihalf = 0.001 ± 0.001 cd/m2, n = 0.60 ± 0.04; Pd−/−, Ihalf = 0.004 ± 0.001 cd/m2, n = 0.63 ± 0.03).