Figure 2.
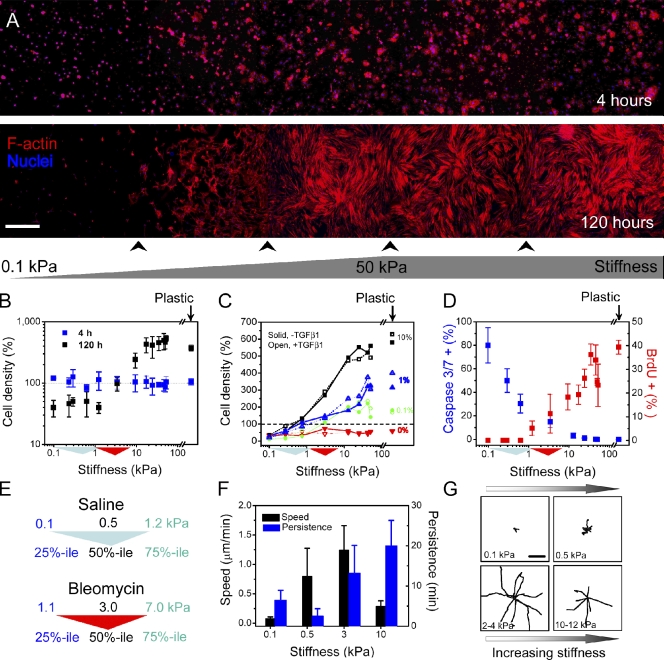
Fibroblasts preferentially accumulate across stiffness gradient. (A) Human lung fibroblasts stained with phalloidin (red) to visualize F-actin and Hoechst 33342 (blue) to visualize nuclei. Cells attach uniformly across the stiffness gradient 4 h after seeding. After 120 h, fibroblasts accumulate preferentially to stiffest region, and cell morphology transitions from round to spread. Panorama images were generated by imaging the entire gel width along the stiffness gradient and then tiling five to seven adjacent pictures. Arrowheads below the image indicate stitching positions. (B) Cell density is constant across the gradient after 4 h, but by 120 h, cells dramatically accumulate at stiffness >3 kPa and are lost below this stiffness level (note logarithmic scale). Density values are normalized to the global mean at 4 h. (C) Serum but not TGF-β1 is required for stiffness-dependent cell accumulation. Serial dilutions of serum gradually attenuate the stiffness-dependent accumulation behavior (black, 10% FBS; blue, 1% FBS; green, 0.1% FBS; red, 0% FBS). 2 ng/ml exogenous TGF-β1 shows little effect on cell density (open symbols and dotted lines) at any serum concentration. (B and C) Dashed lines indicate that cell density values are normalized to the global average obtained at 4 h. (D) Quantification of substrate stiffness effects on fibroblast apoptosis (blue indicates percentage of cells exhibiting caspase 3/7 activity after 24-h serum deprivation) and proliferation (red indicates percentage of nuclei positive for BrdU incorporation in 10% FBS). Standard deviation is from three independent experiments. (E) In panels B–D, colored triangles along the x axis are used to indicate the interquartile and median stiffness values of lung parenchyma from saline (cyan)- or bleomycin (red)-treated mice. (F) Fibroblast migration speed and persistence vary along substrate stiffness as measured with time-lapse video microscopy. Error bars indicate SD from 12 cells for each condition from two independent experiments. (G) Fibroblast migration tracks on stiffness gradient gels obtained from time-lapse video microscopy. Digital images were taken every 2 min for a total of 5 h per experiment. Each wind rose plot shows centroid tracks from 7–10 representative cells from each indicated stiffness region, with the initial position of each track superimposed at a common origin. Bars: (A) 500 µm; (G) 50 µm.

