Figure 2.
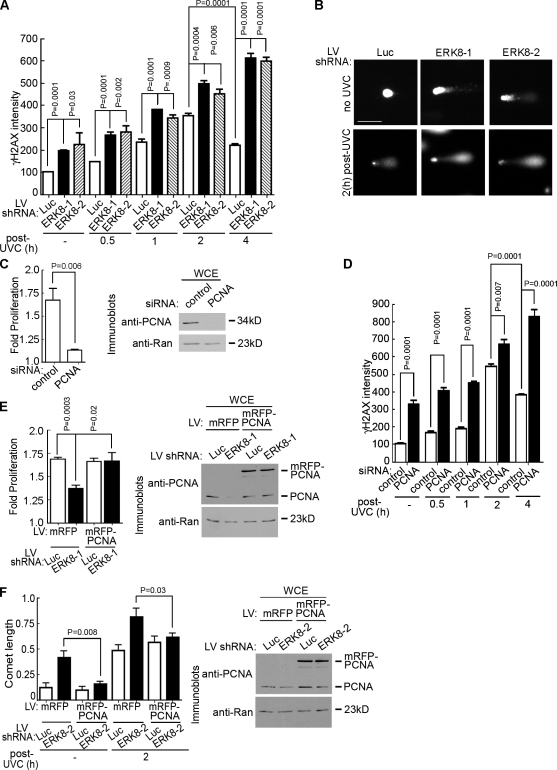
ERK8 regulates DNA repair by a PCNA-dependent mechanism. (A) Analysis of DNA damage by γ-H2AX immunofluorescence in ERK8 knockdown cells. MCF-10A cells transduced for 5 d were treated with or without (−) 20 J/m2 UVC. The times indicated refer to the length of time after irradiation. At the indicated time, the cells were treated with detergent, fixed, and immunostained with an anti–γ-H2AX antibody and an anti–mouse fluorescent secondary antibody. Nuclei were stained with DRAQ5. The intensity of γ-H2AX staining was determined and normalized to the levels obtained in the control cells, which were transduced with luciferase (Luc) shRNA and not irradiated. Mean is shown (n = 2, duplicates, ≥35 cells/condition), and error bars indicate SEM. (B) Analysis of DNA damage by comet assay of cells transduced as in A, without irradiation or 2 h after UVC treatment. DNA was visualized by staining with Sybr green (Trevigen, Inc.). Bar, 50 µm. (C) Rate of proliferation of MCF-10A cells transfected with control or PCNA-specific siRNA. The rate of proliferation was determined over 48 h, starting at 2 d after transfection. Mean is shown (n = 4, sextuplicate), and error bars indicate SEM. The right panel shows the extent of PCNA knockdown 4 d after transfection in lysates normalized for Ran. (D) Analysis of DNA damage by γ-H2AX immunofluorescence in PCNA knockdown cells. Cells transfected as in C were treated as in A, and the intensity of γ-H2AX staining was determined and normalized to the levels obtained in the control cells, which were transfected with control siRNA and not irradiated. Mean is shown (n = 2, duplicates, ≥40 cells/condition), and error bars indicate SEM. (E) Rescue of proliferation by ectopic expression of PCNA in ERK8 knockdown cells. MCF-10A cells were transduced with mRFP or mRFP-PCNA and then transduced a second time with control or ERK8-specific shRNA. The rate of proliferation was determined over 48 h, starting at 4 d after transduction. Mean is shown (n = 4, quadruplicate), and error bars indicate SEM. The right panel shows the level of mRFP-PCNA (∼62 kD) in comparison with endogenous PCNA (∼34 kD). (F) Comet assay of MCF-10A cells transduced as in E. Transduced cells were treated as in B, and tail length was measured. Mean is shown (n = 2, duplicates), and error bars indicate SEM. The right panel shows the level of mRFP-PCNA (∼62 kD) in comparison with endogenous PCNA (∼34 kD). LV, lentivirus; WCE, whole cell extract.

