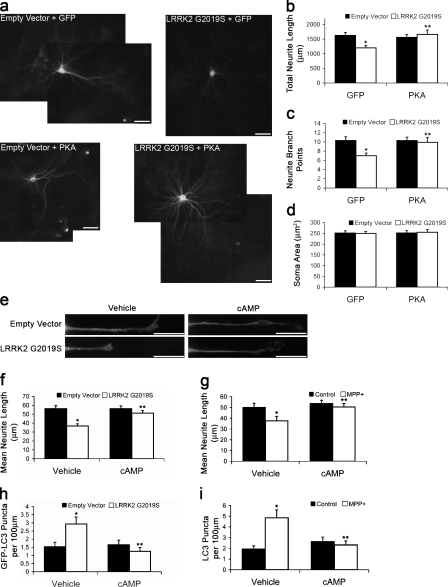
Figure 1.
PKA signaling reduces neurite injury and autophagy. (a–d) Mouse cortical neurons coexpressing GFP or GFP-PKA and LRRK2 G2019S or vector 7 d after transfection. (b) Quantification of neurite lengths. *, P = 0.001 versus empty vector/GFP; **, P = 0.007 versus LRRK2 G2019S/GFP (n = 50–60 cells/condition). (c) Quantification of branch points. *, P = 0.001 versus empty vector/GFP; **, P = 0.015 versus LRRK2 G2019S/GFP (n = 50–60 cells/condition). (d) Quantification of soma area (n = 50–60 cells/condition). (e, f, and h) SH-SY5Y neurites expressing GFP-LC3 48 h after transfection with/without cAMP for 24 h. (f) Quantification of neurite lengths. *, P = 1.48 × 10⁻⁵ versus empty vector/vehicle; **, P = 9.21 × 10⁻⁵ versus LRRK2 G2019S/vehicle (n = 80–90 cells/condition). (g) Quantification of neurite lengths from MPP+-treated SH-SY5Y cells with/without cAMP for 48 h. *, P = 0.0298 versus control/vehicle; **, P = 0.0166 versus MPP+/vehicle (n = 50–60 cells/condition). (h) Quantification of GFP-LC3–labeled puncta with/without cAMP for 24 h. *, P = 0.006 versus empty vector/vehicle; **, P = 6.58 × 10⁻⁴ versus LRRK2 G2019S/vehicle (n = 80–90 cells/condition). (i) Quantification of GFP-LC3 puncta from MPP+-treated SH-SY5Y cells with/without cAMP. *, P = 6.06 × 10⁻⁴ versus control/vehicle; **, P = 0.004 versus MPP+/vehicle (n = 50–55 cells/condition). Error bars indicate mean ± SEM. Bars, 20 µm.

