Figure 4.
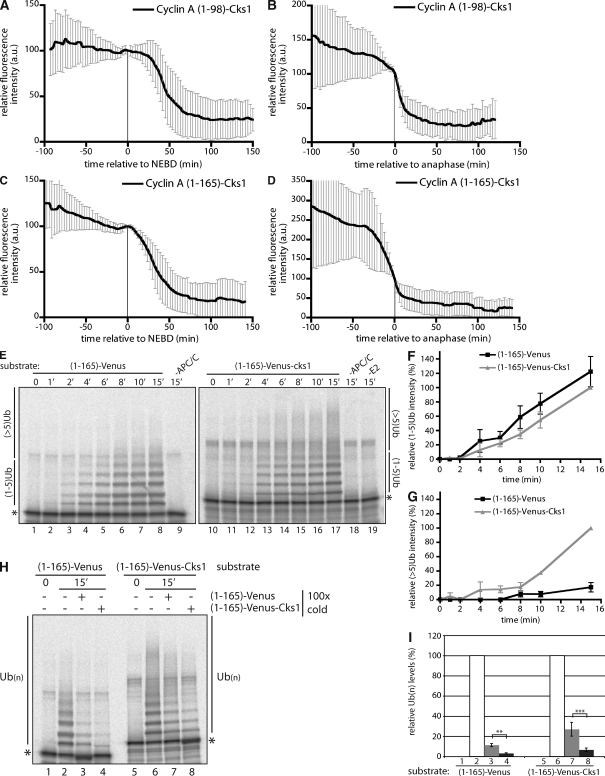
Cyclin A–associated Cks1 increases the efficiency of cyclin A ubiquitylation. (A–D) Cells were injected in G2 phase with cyclin A (1–98)–Venus-Cks1 (A and B) or cyclin A (1–165)–Venus-Cks1 (C and D), and the fluorescence was measured through mitosis. Time is relative to NEBD (A and C) or anaphase (B and D). Error bars indicate mean ± SD of 19 cells from two experiments (A and B) or 24 cells from two experiments (C and D). (E) In vitro ubiquitylation assay of cyclin A (1–165)–Venus (lanes 1–9) or cyclin A (1–165)–Venus-Cks1 (lanes 10–19). Reactions were performed for the indicated time (shown in minutes) before analysis by SDS-PAGE and phosphoimaging. Control reactions are without APC/C (lanes 9 and 18) or E2 (lane 19). (F and G) Quantification of ubiquitin conjugates in E with one to five ubiquitin (F) and more than five ubiquitin (G) molecules were normalized to the total amount of ubiquitylated substrate. (F and G) Error bars indicate mean ± SEM from four experiments. (H) Ubiquitylation reactions for cyclin A (1–165)–Venus (lanes 1–4) and cyclin A (1–165)–Venus-Cks1 (lanes 5–8). 100 times excess of unlabeled cyclin A (1–165)–Venus (lanes 3 and 7) or cyclin A (1–165)–Venus-Cks1 (lanes 4 and 8) was added as a competitor at the beginning of the reaction. (I) Quantification of reactions in H. Numbers correspond to lanes in H. *, unmodified substrate; **, P < 0.01; ***, P < 0.05 (calculated using Student’s t test).

