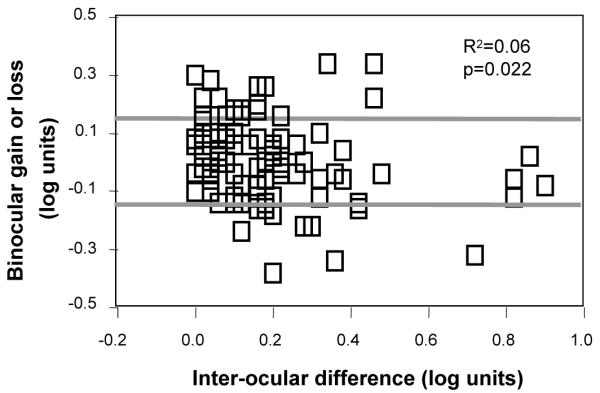
Figure 1.

The degree of binocular gain (positive values) and loss (negative values) plotted as a function of interocular difference on this measure (SKILL dark chart acuity). Points falling above or below the region bounded by a rectangle represent significant gain (above) or loss (below).
