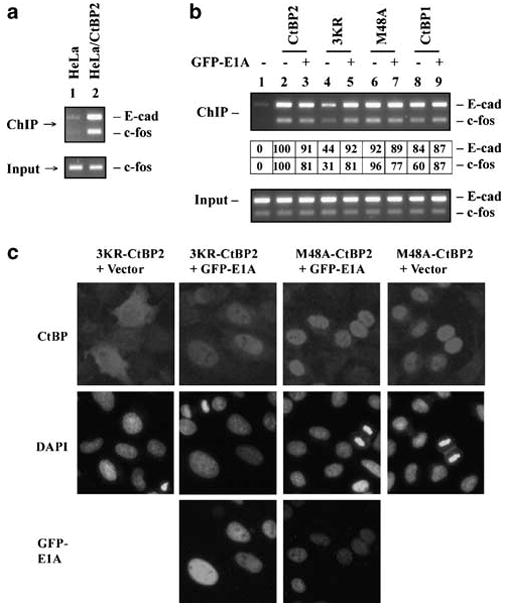
Figure 5.

Localization of CtBP at the cellular promoters. (a) ChIP analysis of CtBP2 binding to E-cad and c-fos promoters. Lane 1, normal HeLa cells. Lane 2, HeLa cells stably expressing Flag-HA-tagged CtBP2. ChIP was performed with the Flag antibody. PCR reactions for E-cad and c-fos promoters (370 and 190 bp, respectively) were carried out in the same reactions. (b) Localization of CtBP at E-cad and c-fos promoters. ChIP analysis was performed with HeLa cells that were transiently transfected with various CtBP constructs in the presence or absence of GFP-E1A. For the ChIP data table (middle of panel), signal in lane 1 was subtracted from other lanes and the signal in lane 2 was normalized to 100 for both E-cad and c-fos. (c) Effect of E1A on subcellular localization of CtBP2 mutants. Immunofluorescence analysis was carried out using HeLa cells transfected with the indicated plasmids. The cells were stained with Flag-Cy3 antibody to localize CtBP proteins 24 h after transfection.
