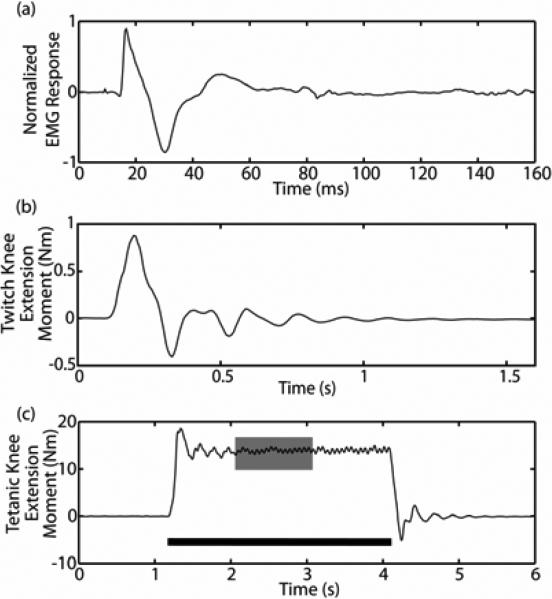
Figure 2.
(a.) An example of a typical normalized fine-wire intramuscular EMG response to a single stimulus pulse delivered via a nerve-cuff electrode contact. The triphasic M-wave response to stimulation occurs within the first 40 ms after stimulation (which occurs at t=0 s). (b.) A typical twitch knee extension moment response to a single stimulus pulse applied at t=0 s. The maximum of the response is calculated to create twitch recruitment curves. (c.) A typical tetanic knee extension moment response to a 3 second, 16 Hz train of stimuli (black bar). The middle one second of the three second response (gray box) is averaged to create tetanic recruitment curves.

