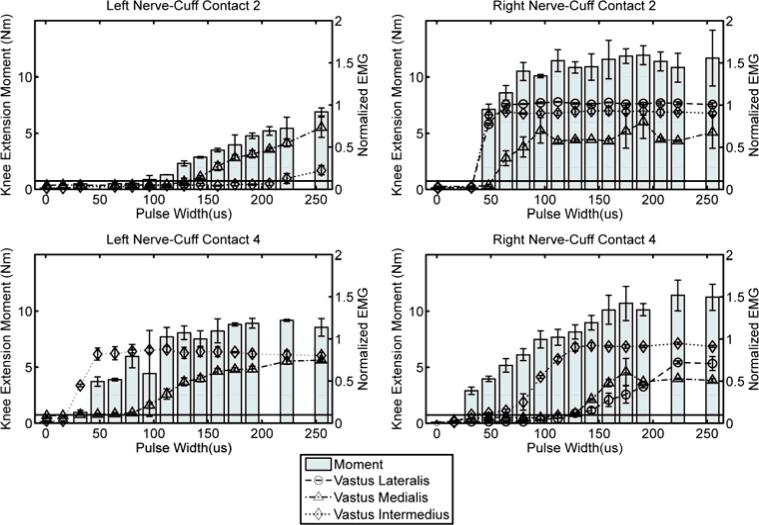
Figure 4.
Mean twitch EMG and isometric knee extension moment recordings when single stimulus pulses were applied three times via left nerve-cuff contacts 2 and 4 and right nerve-cuff contacts 2 and 4. Error bars are standard deviation. The horizontal black line on each plot marks 10% of normalized EMG, which is considered threshold for activation. All stimulus pulses were applied at a current amplitude of 1.4 mA.

