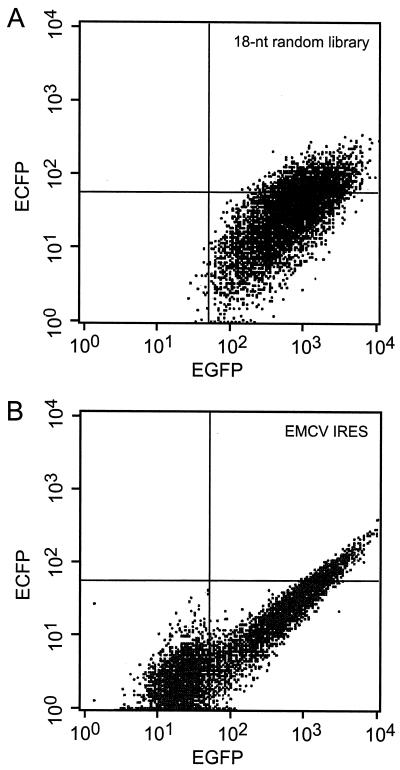
Figure 2.
Profiles of EGFP and ECFP expression by infected cells. Two-dimensional frequency histogram plots show the log of fluorescence emission attributable to EGFP (x axis) and ECFP (y axis). The quadrants were determined in control experiments with B104 cells that expressed EGFP (Lower right quadrant), cells that expressed ECFP (Upper left quadrant), and nonexpressing cells (Lower left quadrant). Cells in the upper right quadrant expressed both EGFP and ECFP. (A) B104 cells infected with the 18-nt random library and sorted twice for coexpression of EGFP and ECFP. (B) B104 cells infected with a dicistronic viral vector containing the EMCV IRES in the intercistronic region between EGFP and ECFP.

