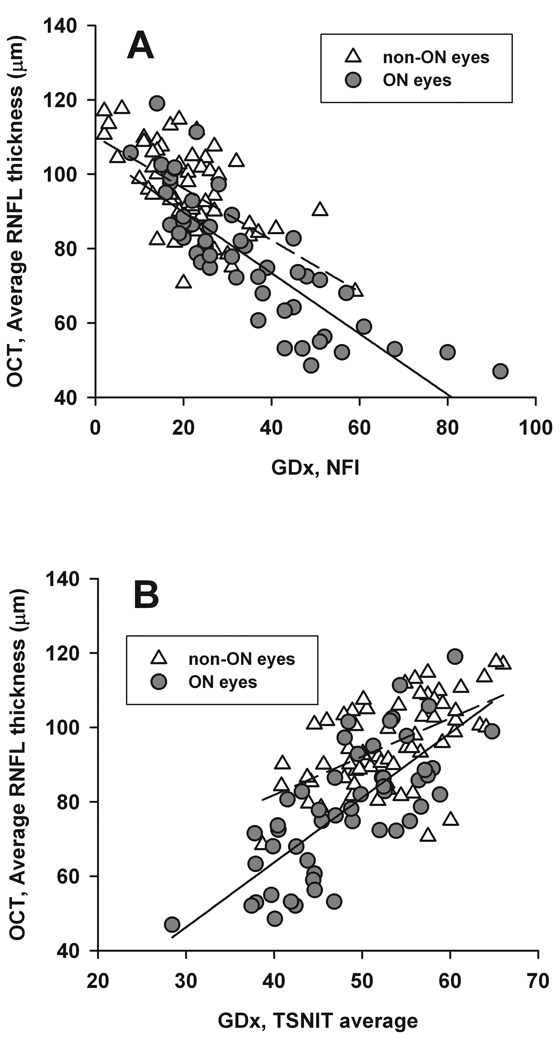
Figure 1.
Scatter plots and linear regression between OCT average RNFL thickness (µm) and GDx NFI (top), GDx TSNIT average (bottom). Solid line delineates regression for ON eyes, and dashed line for non-ON eyes. In the top figure, R2 is 0.69 (P < 0.0001) for ON eyes, and 0.37 (P < 0.0001) for non-ON eyes. In the bottom figure, R2 is 0.55 (P < 0.0001) for ON eyes, and 0.31 (P < 0.0001) for non-ON eyes.

