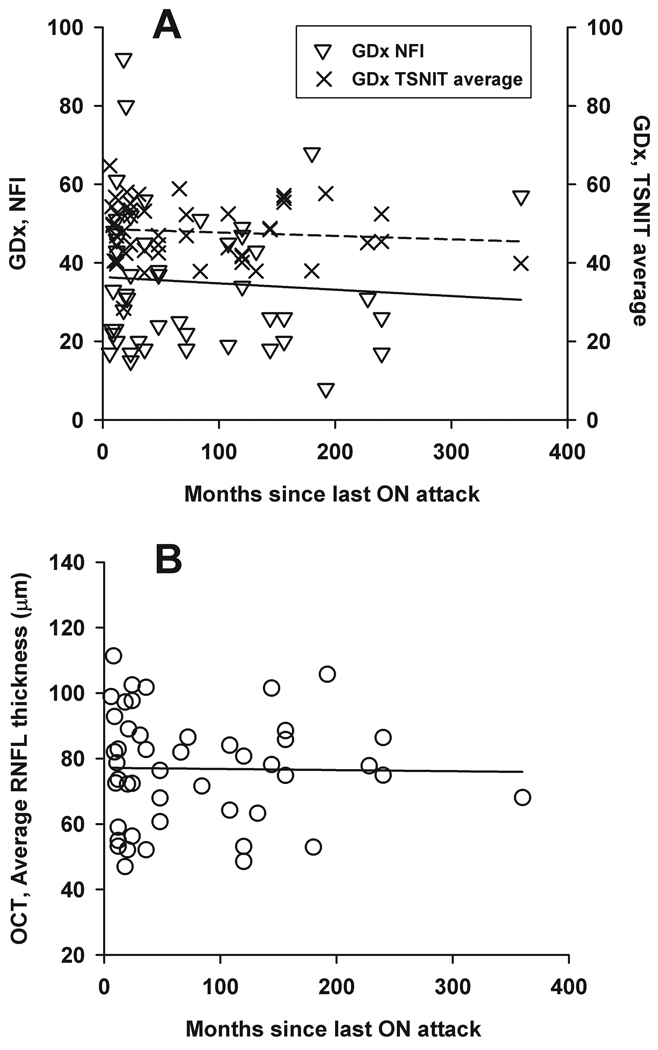
Figure 2.
Scatter plots and linear regression between the time since last ON attack and three parameters: GDx NFI (open triangles and solid line in top figure), GDx TSNIT average (crosses and dashed line in top figure), and OCT average RNFL thickness (bottom). The slopes and the P values for the regression lines are − 0.02 (P = 0.62), 0.00 (P = 0.52), and 0.00 (P = 0.91) for GDx NFI, GDx TSNIT average, and OCT average RNFL thickness, respectively.

