Figure 5.
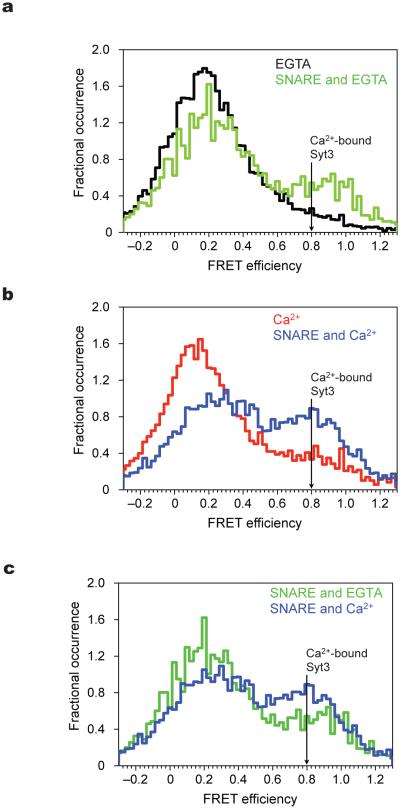
Syt3 C2AB conformational dynamics in the presence of SNARE complex. Experimental conditions as in Fig. 3. (a) smFRET efficiency histograms of Syt3 in the absence of Ca2+ and absence (black) and presence (green) of SNARE complex. (b) smFRET efficiency histograms of Syt3 in the presence of Ca2+ and absence (red) and presence (blue) of SNARE complex Ca2+. Position of FRET efficiency expected for SNARE induced Ca2+-bound Syt3 crystal structure is shown (black arrow). The distance between ‘ticks’ on the X-axis corresponds to histograms’ bin width. (c) For better comparison, shown is an overlay of the same smFRET efficiency histograms from panels a and b in the presence of SNARE complex and presence (blue) or absence (green) of Ca2+. In order to quantify the increase in the high FRET population in panels a–c, we have fitted the FRET efficiency histograms to the sum of two Gaussian distributions. This fitting method is based on the observation that a smFRET distribution arising from a single state can be approximated by a Gaussian distribution. We chose the minimum number of states (two) that are required to fit the observed smFRET distributions. In the absence of Ca2+ and SNARE complex (panel (a), black line), the area of the high FRET population is 12%. The increases over this background of the high FRET state are: 10% for Ca2+ only (panel (b), red line), 14% for SNARE complex only (panel (a), green line), and 36% for SNARE complex plus Ca2+ (panel (b), blue line).

