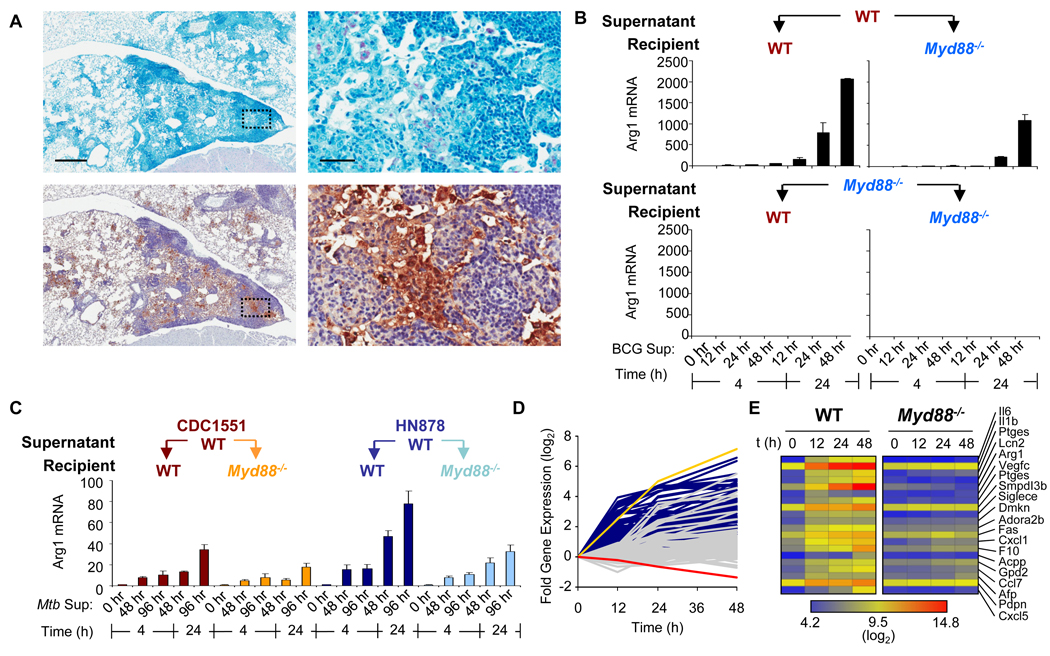
Fig. 1.
Mycobacteria-infected cells secrete factor(s) that induce the expression of Arg1. (A) Wild-type mice (n = 4) were infected intranasally with BCG. Four weeks after infection, mice were sacrificed and lungs were prepared for histology by staining for acid-fast bacilli (pink, top) and for Arg1 (brown, bottom). Scale bars represent 500 µm (left panels) and 50 µm (right panels). (B) BMDMs from wild-type and Myd88−/− mice (n = 2 mice) were infected with BCG (at MOIs of 100 and 10) for 12, 24, and 48 hours. Supernatants (a 1:2 dilution of the combined supernatants from both sets of infections) were used to stimulate BMDMs from wild-type or Myd88−/− mice for either 4 or 24 hours. RNA was analyzed by qRT-PCR. Data shown are the mean fold-increase in Arg1 mRNA ± the standard deviation (SD), and are representative of two experiments (A and B). (C) BMDMs from wild-type mice were infected with Mtb strains CDC1551 and HN878 (n = 3). Supernatants from these infections were used to stimulate wild-type and Myd88−/− BMDMs (n = 3). RNA was analyzed by qRT-PCR. Data shown are the mean fold-increase in Arg1 mRNA ± the standard deviation (SD), and are from one experiment. (D and E) BMDMs from wild-type and Myd88−/− mice were infected with BCG over the indicated times. RNA from these infected cells was subjected to Affymetrix expression analysis. (D) Profiles of the fold-increase in gene expression of wild-type (dark blue traces, with Arg1 as the yellow trace) and Myd88−/− (gray traces, with Arg1 as the red trace) over time in log2 scale after infection with BCG. (E) Gene expression heat map clustered by secreted or extracellular GO terms.

