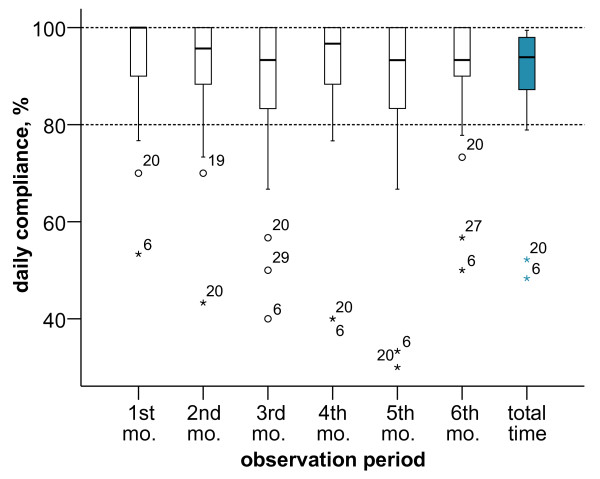
Figure 1.
Daily compliance during study observation period for each month and the entire observation period. The ends of the whiskers represent the lowest data value within 1.5 times the box height from the lower box edge and the highest data value within 1.5 times the box height from the upper box edge, respectively. Index numbers represent individual patients ID: if associated with circle, this ID was regarded as outlier (1.5-3 times box height from the box edge), if with a star as extreme value (> 3 times box height from the box edge); mo. = month.

