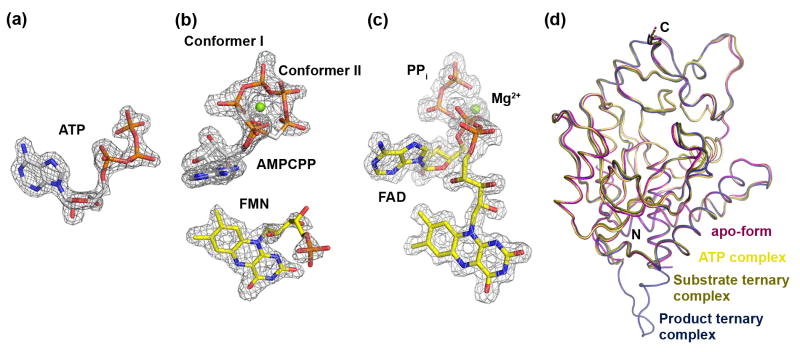
Figure 2. Electron densities of the bound ligands and comparison of CgFMNAT structures.
Simulated-annealing Fo-Fc omit maps of (a) ATP in the binary complex; (b) AMPCPP and FMN in the substrate ternary complex, and (c) FAD and PPi in the product ternary complex. The maps are contoured at 3.0σ for (a) and (c), and 2.5σ for (b). (d) Superposition of apo-form (magenta), ATP complex (tan), substrate ternary complex monomer C (dark yellow), and product ternary complex monomer B (dark blue).

