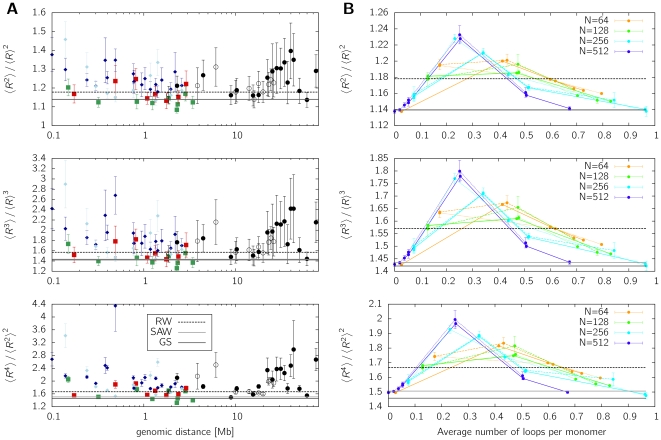
Figure 4. Higher-order moments of the distance distributions for experimental data (A) and for the chromatin model (B) according to eq. (4).
A. The following experimental data is shown: Human fibroblasts Chr1
[12]: red ▪ anti-ridge region, green ▪ ridge region,  long distance measurements; Human fibroblast Chr 11
[12]:
  long distance measurements; Murine Igh locus
[27]: dark blue ⧫ pre-pro-B cells, light blue ⧫ pro-B cells. The data displays strong deviations towards larger fluctuations in comparison to the random walk (RW), self-avoiding walk (SAW) and globular state (GS) polymer model. B. Results are shown for simulated polymers of various length (
 and
and  ) in relation to the average number of loops per monomer, which is related to the looping probability but allows for a better comparison. Although incorporating full excluded volume interactions, fluctuations exceed the random walk value due to probabilistic looping.

