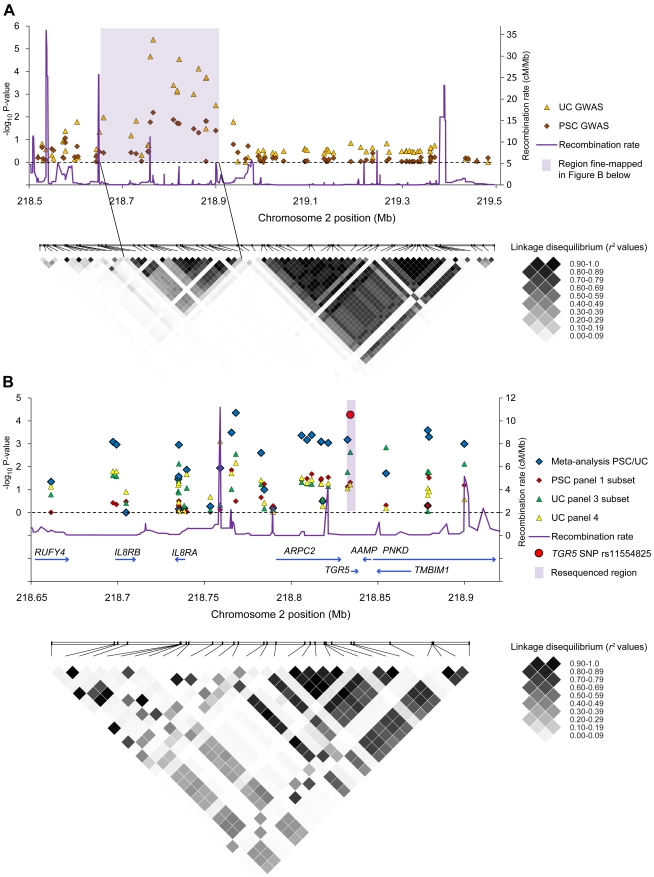
Figure 6. Genetic analyses at chromosome 2q35.
Panel A shows results from the association analysis (negative log10-transformed p-values plotted on the vertical axis) of individual single-nucleotide polymorphisms (SNPs) at chromosome 2q35 in data sets from previous genome-wide association studies (GWAS) in primary sclerosing cholangitis (285 patients and 298 healthy controls) and ulcerative colitis (1167 patients and 777 healthy controls) [20], [21]. A linkage disequilibrium (LD) plot below shows pairwise LD (r 2) between the SNPs, calculated in the healthy controls, where increasing r 2 values correspond to increasing LD. The shaded area covers the peak of associated SNPs corresponding to a region with strong LD. Panel B shows fine-mapping of the shaded region in Panel A performed in three patient panels (details of the analysis are shown in Results S1). The individuals in the PSC panel 1 subset (285 patients and 296 healthy controls) completely overlapped with the PSC GWAS in panel A, while the individuals in the UC panel 3 subset (521 patients, 1096 controls) and UC panel 4 (361 patients, 1104 controls) were independent from the UC GWAS in panel A. In addition to association analyses in the individual study panels, a PSC-UC meta-analysis of all fine-mapped patients (n = 1167) and healthy controls (n = 2496) was performed. The fine-mapped region was characterized by strong LD, as shown in the lower plot, but a recombination hot-spot was present between the IL8RA and IL8RB loci and the TGR5 (GPBAR1) locus and neighboring genes (ARPC2-TGR5-AAMP-TMBIM1-PNKD). The meta-analysis p-value of the TGR5 exon 1 SNP rs11554825 is highlighted in red, while the shaded area in Panel B shows the resequenced region covering TGR5.

