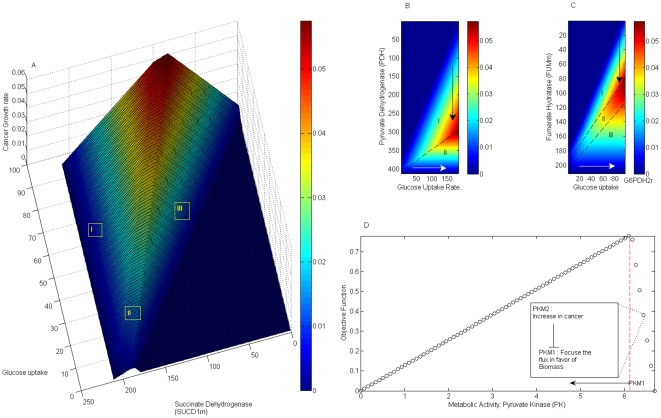
Figure 6. Phenotype phase plane for glycolytic and TCA cycle enzymes.
Panel (A) is a three-dimensional representation of how metabolic activity of succinate dehydrogenase and glucose uptake rate influence growth. As Panels (B) and (C) show, in silico modeling leads us to identify some regions where variations on pyruvate dehydrogenase and fumarate hydratase, both associated with tumor suppressor activity, can result in different phenotypes. White lines indicate the direction at which the metabolic fluxes increase; black lines, the direction at which they decrease. The potential effect that pyruvate kinase activity can produce on cancer cell growth is depicted in (D). In panel (D) objective function components were selected as follows: cATP = 12.47, cLactate = 0.13, cNADPH = 0.93, cR5P = 0.6, cNAD = 0.89, cOAA = 0.75, cATP[m] = 17.09 and cCitrate = 0.55. The threshold flux activity is denoted by a red line.

