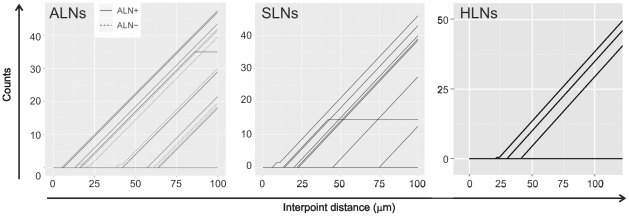
Figure 3. Plots illustrating the number of TDLNs and HLNs in which B cells were found to be more clustered than the T cells.
Each line represents data from 1 lymph node. The shorter the interpoint distance at which the B cells' L function exited above the confidence envelope, the more clustered B cells are compared to the T cells. Below the interpoint distance of 100 µm, the number of lines that represent the L function of B cells outside of the T cells' envelope is as follows: 9 out of 10 (90%) ALNs+, 6 out of 10 ALNs−, 8 out of 15 (53%) SLNs+ and 3 out of 7 (43%) HLNs. The counts indicated how much more clustered B cells are compared to T cells, and were determined as follows: we evaluated the L-function of the B cells for interpoint distances of 0 to 100 µm in 2 µm increments and compared it with the confidence envelope of the L-function for the T cells. For each interpoint distance increment of 2 µm for which the L-function of the B cells lay above the envelope, the value of the counts increased by one. The starting point was set at 0.

