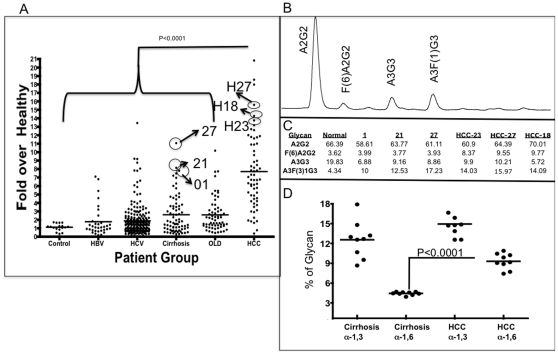
Figure 4. Increase in lectin-reactive A1AT with the development of HCC and identification of core fucose as a specific marker of liver cancer.
(A) The level of lectin-reactive A1AT in patients with HCC, HBV infection, HCV infection, or other liver diseases (OLD) and in controls. The solid line represents the mean value. The x-axis represents the patient group. The y-axis shows the -fold increase in lectin-reactive A1AT compared with that in commercially purchased serum. (B) Glycan analysis of A1AT isoform M4 from patient 21. (C) Quantification of glycan analysis from three cirrhotic patients (01,21 and 27) and three patients with stage 1 or 2 HCC (HCC-23, HCC 27 and HCC 18). The levels of 4 major glycan structures are shown. As this figure shows, in cirrhotic false positives, there is an increase in outer arm but not core fucosylation. Consistent with data shown in Figures 2 and 3, increases in core fucosylation on AAT were observed only from patients with HCC. (D) Scatter plot of the level of α-1,3 or α 1,6 linked fucose from 9 cirrhotic false positives and 9 patients with either stage 1 or 2 HCC.

