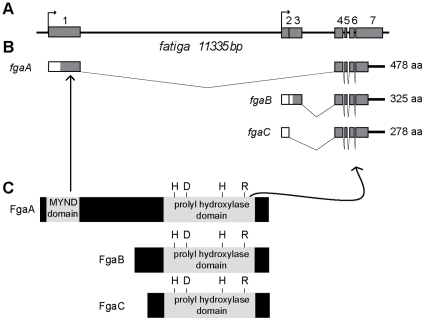
Figure 1. The fatiga gene locus.
A) Schematic representation of the fga locus. Grey boxes represent exons, black lines are introns and arrows indicate transcription initiation sites. B) fgaA, fgaB and fgaC transcripts are generated by a combination of alternative splicing and alternative initiation of transcription. Coding regions are represented by grey boxes, and untranslated regions (UTRs) are representated by white boxes. C) All three transcripts give rise to proteins containing a prolyl hydroxylase domain, whereas only FgaA has a MYND domain.

