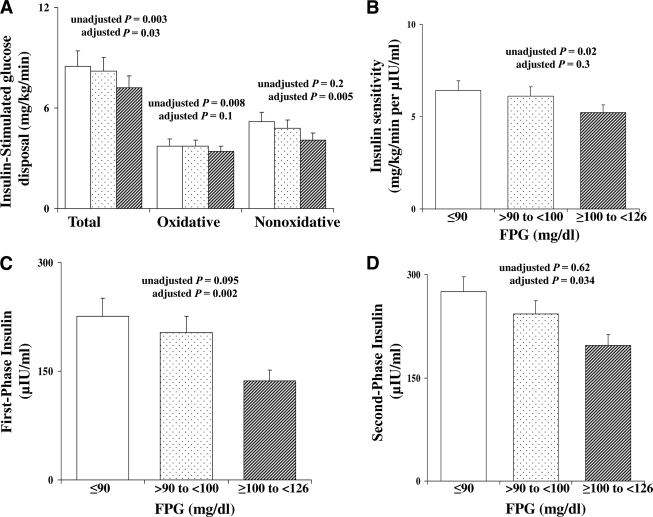
Figure 1.
Insulin-stimulated glucose disposal (total, oxidative, and nonoxidative) (A) and insulin sensitivity (B) during the hyperinsulinemic-euglycemic clamp and first- and second-phase insulin levels (C and D) during the hyperglycemic clamp in youth with FPG ≤90 mg/dl (□), >90–<100 mg/dl ( ), and ≥100–<126 mg/dl (▨). Data represent the estimated marginal means from the ANCOVA model corrected for BMI. P values unadjusted and adjusted for BMI are shown.

