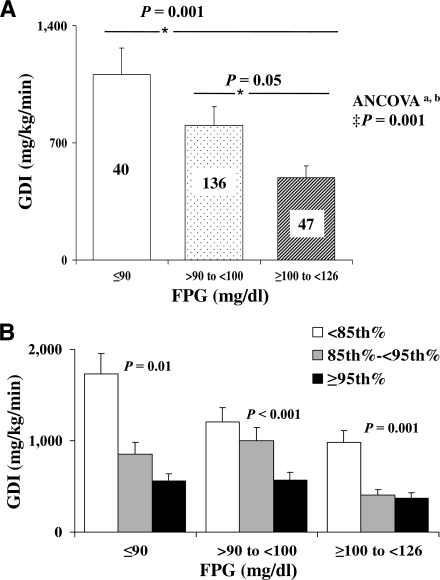
Figure 2.
A: GDI (milligrams per kilogram per minute) in youth with FPG ≤90 mg/dl (□), >90–<100 mg/dl ( ), and ≥100–<126 mg/dl (▨). Data represent the estimated marginal means from the ANCOVA model. ‡Covariates appearing in the model are age, sex, race, Tanner stage, BMI, and VAT. aP = 0.002 when fat mass is added as a covariate to the model; bP = 0.003 when fat mass, lean mass, and height are added as covariates to the model. *P represents post hoc Bonferroni correction. B: GDI (milligrams per kilogram per minute) in youth with FPG ≤90 mg/dl, >90–<100 mg/dl, and ≥100–<126 mg/dl according to BMI <85th percentile (□), between the 85th and 95th percentiles (
 ), and ≥95th percentile (■). P represents ANOVA.

