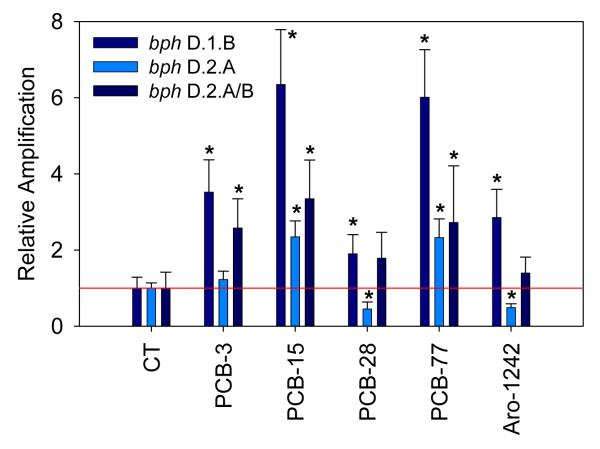
Figure 4.
Quantification of bacterial biphenyl dioxygenase (BPH) genes: D.1.B, D.2.A, and D.2.A/B in microcosm experiments after 4 weeks of incubation in the presence of different PCB congeners, as determined by real-time PCR relative quantification. Ribosomal DNA (16S rDNA) was used as an internal calibrator and the amplification levels were normalized by reference to non-exposed microcosms (CT). The error bars represent standard deviations between experimental triplicates. Abundance of BPH genes in PCB-exposed samples showing statistically significant increase by comparison with non-exposed controls were marked with a star (*).

