Figure 4.

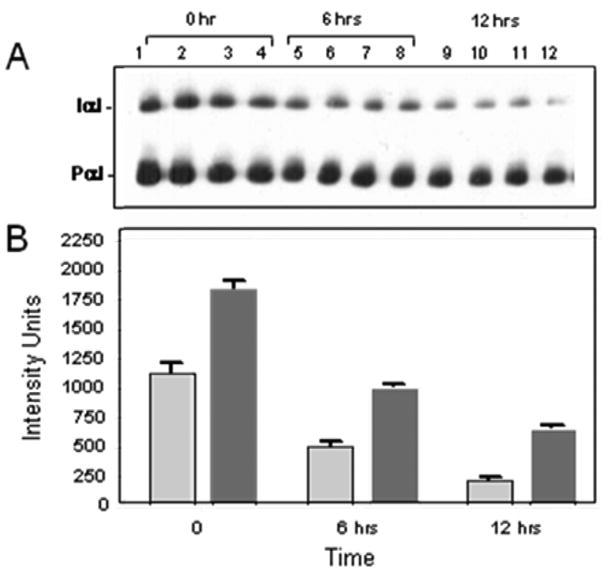
Western blot (A) showing changes in endogenous, mouse IaIp (gray) and the Pre-alpha Inhibitor (dark gray) following administration of LPS. (B) The differences between each time point are all significant, p<0.05.

Western blot (A) showing changes in endogenous, mouse IaIp (gray) and the Pre-alpha Inhibitor (dark gray) following administration of LPS. (B) The differences between each time point are all significant, p<0.05.