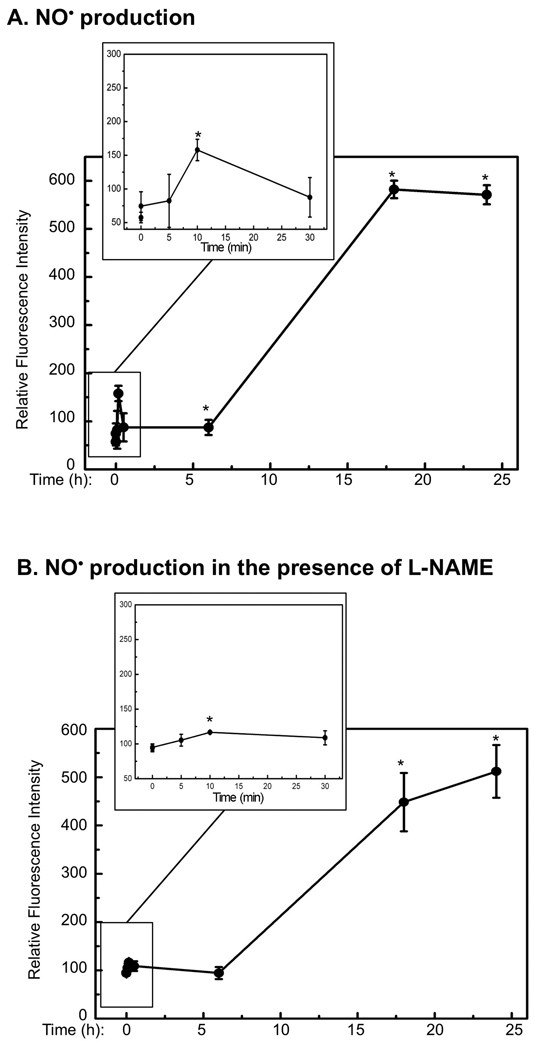
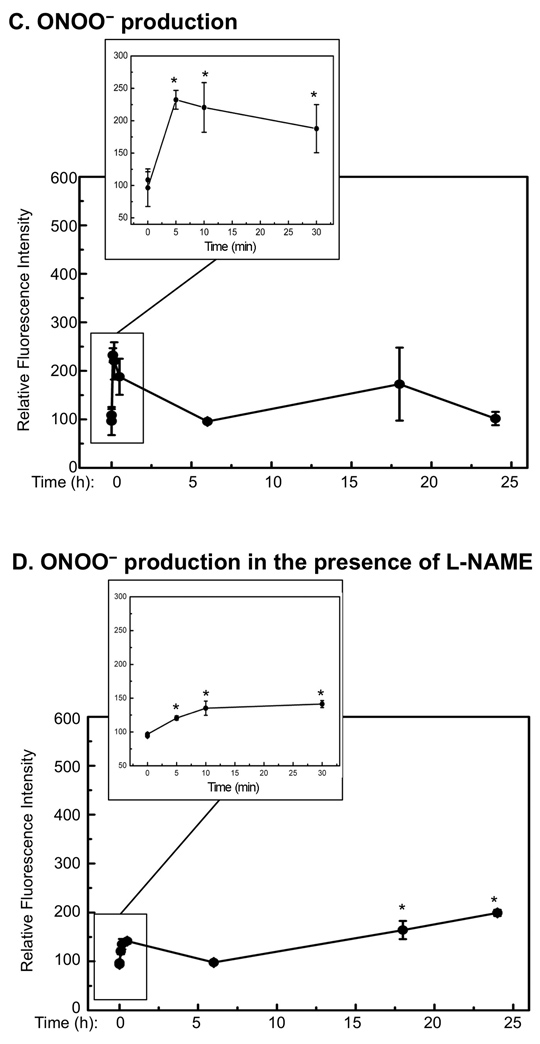
Fig. 2.
Quantitative analysis of NO• and ONOO− after UVB-irradiation. HaCaT cells were irradiated with UVB (75 mJ/cm2) in the absence or presence of L-NAME. At the indicated time-points post-UVB-irradiation, the cells were stained with DAF-2DA or DAR. The fluorescence intensity was then measured and corrected with respect to cell viability. The fluorescence intensities of (A) NO• in the absence of L-NAME; (B) NO• in the presence of L-NAME; (C) ONOO− in the absence of L-NAME; and (D) ONOO− in the presence of L-NAME were shown. The error bars present the standard deviations of 3 independent experiments. *: p<0.05 vs. control.


