
Figure 1. Hierarchical clustering of differentially expressed genes.
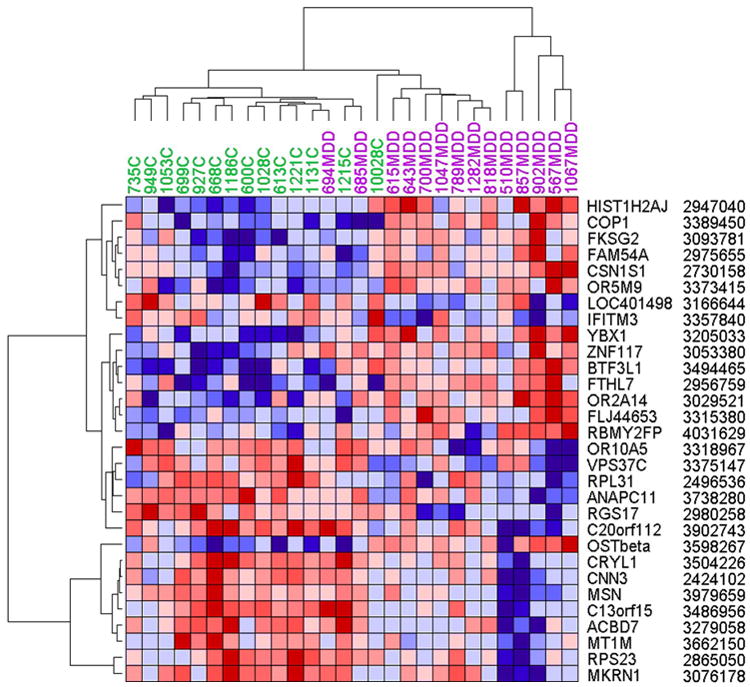
Normalized log2 intensities were clustered by GenePattern in two dimensions (horizontal: genes; vertical: samples [purple=MDD, green=controls]) on the basis of Euclidian distance. Each colored pixel represents a single gene expression value in one subject. The color intensity is proportional to its relative expression level (blue: under expressed; red: over expressed). Note that the statistical segregation of depressed and control subjects are almost complete, with an overlap of only two controls. Labels on the right denote gene symbols and probe identifiers. For more data, see Table 2.