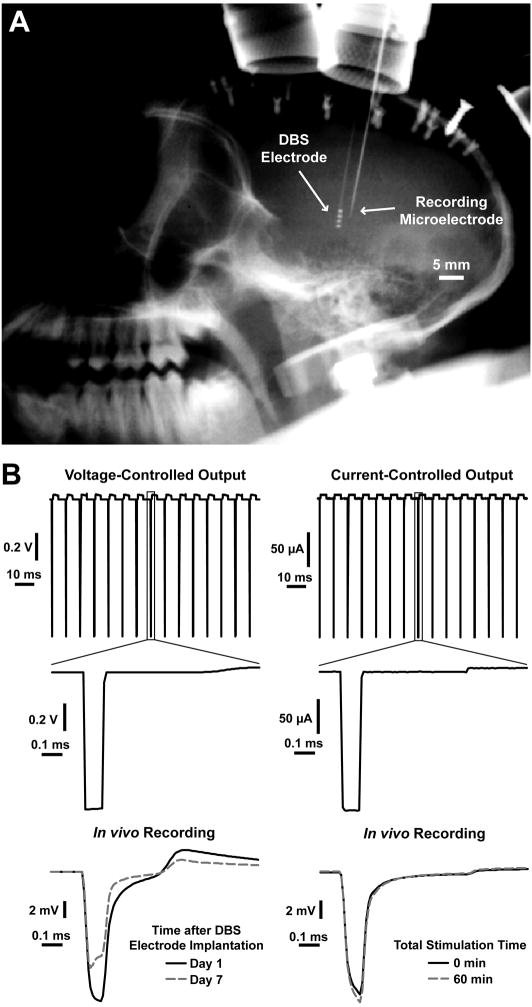
Fig. 1.
In vivo microelectrode recordings examining the temporal evolution of the voltages generated in the brain during DBS. (A) X-ray image showing a chronically-implanted DBS electrode and an acutely-inserted recording microelectrode used to monitor the voltages generated in the brain during DBS. The recording electrode was inserted approximately 2 mm away from the DBS lead. (B) Recordings of the voltage-controlled and current-controlled stimulus waveforms examined in this study and examples of the voltage waveforms recorded in the brain tissue. The example of in vivo voltages recorded during voltage-controlled stimulation is from one of the recording locations shown in Fig. 2A and shows the changes that occur during the first week after DBS electrode implantation. The example recordings for current-controlled stimulation show the small changes that occur during one hour of stimulation.

