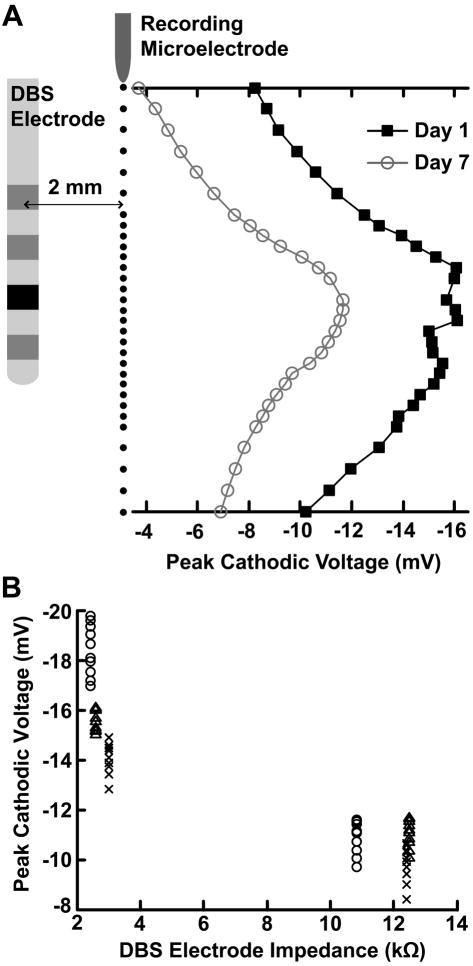
Fig. 2.
Effect of the foreign-body reaction on the voltages generated in the brain during voltage-controlled DBS. (A) Microelectrode recordings were performed 1 day and 7 days after implantation of the DBS electrode at the locations indicated by the linear array of black dots parallel to the electrode. The plotted values display an example of the average peak cathodic voltages measured during voltage-controlled stimulation 1 day and 7 days after implantation for the DBS contact shown in black. (B) Plots of the DBS electrode impedance versus the peak cathodic voltages recorded 1 day and 7 days after implantation for the DBS lead implanted in the STN. Each marker type (i.e. circle, triangle, cross) correspond to an individual DBS contact. Between 1 day and 7 days after implantation, there was a 38.3 ± 10.5% decrease in the peak cathodic voltage and a corresponding average increase in the 1 kHz DBS electrode impedance of 298 ± 136% (n=6). The decrease in the peak cathodic voltage exhibited a strong negative correlation with the increase in the DBS electrode impedance (rs = −0.803, p = 2.61e-28). Ten recording locations centered around each DBS contact were used in this analysis (see Methods), corresponding to ten peak voltage measurements for each DBS electrode impedance.

