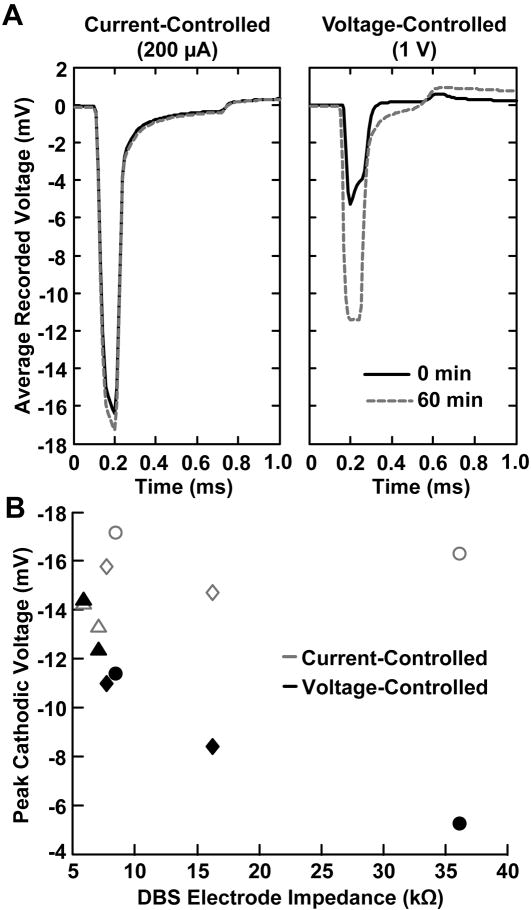
Fig. 4.
Temporal voltage changes observed during current-controlled and voltage-controlled DBS. (A) Microelectrode recordings of the voltages generated in the brain during current-controlled and voltage-controlled DBS. The black line represents the stimulus waveform recorded at the beginning of stimulation and the gray-dashed line represents the stimulus waveform recorded after one hour of stimulation. (B) Plot of the DBS electrode impedance versus the peak cathodic voltages recorded during current-controlled (gray markers) and voltage-controlled (black markers) stimulation. Each marker type corresponds to an individual experiment (i.e. triangle, square, and circle). Current-controlled DBS showed an average increase of only 6.5 ± 1.1 % in the peak recorded cathodic amplitude after 1 hour of stimulation while voltage-controlled stimulation exhibited a larger and much more variable average change of 54.8 ± 54.5% (n=3) (Fig. 4). The average decrease in DBS electrode impedance for this set of experiments was 48.9 ± 30.1 %. The increase in the peak cathodic voltage recorded during voltage-controlled DBS was highly correlated with the decrease in DBS electrode impedance (rs = −0.927, p = 0.017) while the voltage changes recorded during current-controlled DBS were not significantly correlated with the decrease in DBS electrode impedance (rs = 0.657, p = 0.175).

