
Figure 3.
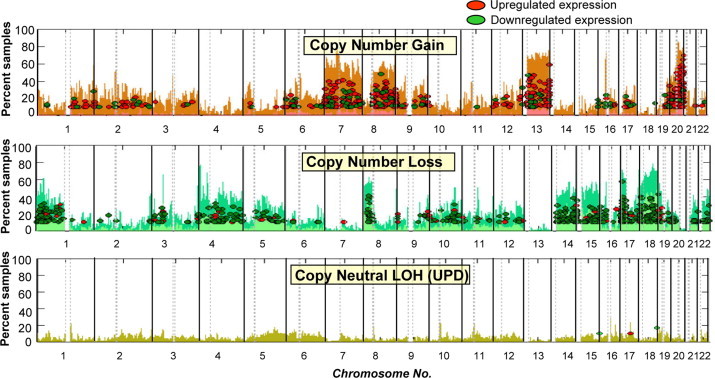
Overall view of gene expression dysregulations within chromosomal aberrations. Shown are the percentages of samples with gains (top chart), losses (middle chart), and copy neutral-LOH or somatic UPDs (bottom chart) in every autosomal chromosome. Each ellipse refers to a U133A probe set representing a gene located in the region of aberration with z ≥ 3 (up-regulated), or z ≤ −3 (down-regulated) in at least 10% of the CRC samples. Note that chromosomal gains and losses are populated by numerous genes that are up-regulated and down-regulated, respectively.