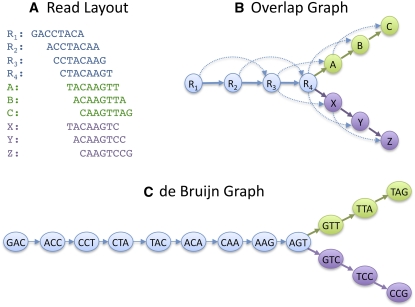
Figure 2.
Differences between an overlap graph and a de Bruijn graph for assembly. Based on the set of 10 8-bp reads (A), we can build an overlap graph (B) in which each read is a node, and overlaps >5 bp are indicated by directed edges. Transitive overlaps, which are implied by other longer overlaps, are shown as dotted edges. In a de Bruin graph (C), a node is created for every k-mer in all the reads; here the k-mer size is 3. Edges are drawn between every pair of successive k-mers in a read, where the k-mers overlap by k − 1 bases. In both approaches, repeat sequences create a fork in the graph. Note here we have only considered the forward orientation of each sequence to simplify the figure.

